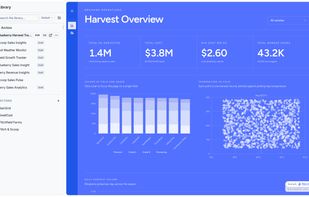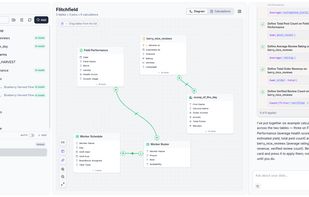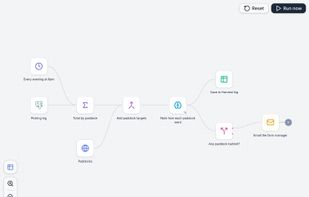
Flitch is a business intelligence platform and app builder, free to start. Connect your data, define your metrics and build dashboards, apps, reports and workflows on your definitions with AI.
Cost / License
- Freemium
- Proprietary
Since
- New
Australia


The best free alternative to Tableau is Grafana, which is also Open Source. If that doesn't suit you, our users have ranked more than 100 alternatives to Tableau and loads of them is free so hopefully you can find a suitable replacement. Other interesting free alternatives to Tableau are GridCraft, Metabase, Microsoft Power BI and Gephi.
Flitch is a business intelligence platform and app builder, free to start. Connect your data, define your metrics and build dashboards, apps, reports and workflows on your definitions with AI.


Full fledge AI (MCP, API, Agents) Analytics (Sheets on data lake) and Business Intelligence Platform (Charts, dashboards and reports).
Auto-Analyst is an analytics platform featuring a FastAPI backend and a Next.js frontend. The system provides AI-driven data analytics, interactive visualizations, and an admin dashboard for monitoring key usage metrics.


Reportr is a web-based reporting and analytics application for querying and exploring data in existing databases. Users can ask questions in natural language through an AI chat interface, refine queries through follow-up questions, and view results as tables or charts.


Redash is an amazing open source tool for querying and visualizing data. It allows you to connect to any data source, easily visualize and share your data, and collaborate with your team.
Self-hosted, open source reporting and dashboards. Drag-and-drop canvas, semantic model with row-level security, pre-aggregation cache. PostgreSQL, MySQL, SQL Server, BigQuery, Snowflake, DuckDB.


PyQueryHub is a comprehensive data analytics platform that connects to multiple databases, enables SQL querying with dynamic parameters, creates interactive visualizations and reports and supports Python notebooks for analysis and many more features.


LivChart is a local-first AI data visualization and dashboard builder. All data processing happens on your device — nothing is uploaded to the cloud.


View, query, and convert Apache Parquet files in your browser. No upload required, everything runs locally.


Turn CSV files and Google Sheets into branded, client-ready PDF reports with AI insights, charts, and anomaly detection in under 30 seconds.


Web-based mapping and analytics tool that searches hundreds of open-data portals, flags each dataset's licence, and automatically joins tables with geographic boundaries. Build maps and charts on a canvas, then publish interactive data stories through a shareable link.