


Szum
Like
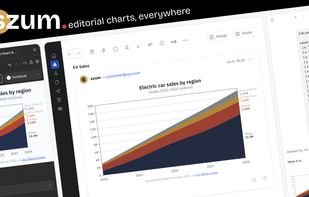
Szum is a chart creation platform for producing publication-ready data visualizations across websites, static images, email, Figma and AI tools.

Cost / License
- Freemium (Subscription)
- Proprietary
Platforms
- Online
- Software as a Service (SaaS)
- Figma


Features
Highlights All activities
Szum News & Activities
Recent activities
- bartok32 added Szum
- Paul updated Szum
 bartok32 added Szum as alternative to ChartURL and Google Charts

Developed by
 Bartosz Prusinowski
Licensing
Proprietary and Freemium product.Pricing
Subscription ranging between $23 and $29 per month + free version with limited functionality.Alternatives
2 alternatives listedBadge
Get an embeddable badge for SzumSupported Languages

No comments or reviews, maybe you want to be first?