sysstat
3 likes
A collection of performance monitoring tools (of which iostat and sar for I/O, CPU, memory and more ) for GNU/Linux OS. Let you monitore ponctually by hand as well as automatically via cron or systemd services.
Cost / License
- Free
- Open Source (GPL-2.0)
Platforms
- Linux
Features
- I/O Monitoring
sysstat News & Activities
Highlights All activities
Recent activities
No activities found.
sysstat information
No comments or reviews, maybe you want to be first?
What is sysstat?
Sysstat's main features:
Includes four groups of monitoring tools (sar / sadc / sadf, iostat / tapestat / nfsiostat / cifsiostat, mpstat, pidstat) for global system performance analysis. Can monitor a huge number of different metrics:
- Input / Output and transfer rate statistics (global, per device, per partition, per network filesystem and per Linux task / PID)
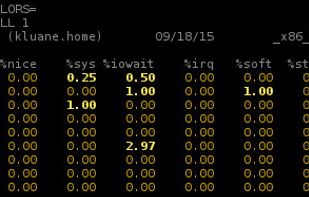
- CPU statistics (global, per CPU and per Linux task / PID), including support for virtualization architectures
- Memory, hugepages and swap space utilization statistics
- Virtual memory, paging and fault statistics
- Per-task (per-PID) memory and page fault statistics
- Global CPU and page fault statistics
- Process creation activity
- Interrupt statistics
- Extensive network statistics: network interface activity; traffic statistics for IP, TCP, ICMP and UDP protocols (incl. IPv6-related) based on SNMPv2 standards, Fibre Channel
- NFS server and client activity.
- Socket statistics.
- Run queue and system load statistics.
- Kernel internal tables utilization statistics.
- System and per Linux task switching activity.
- Swapping statistics.
- TTY device activity.
- Power management statistics (instantaneous and average CPU clock frequency, fans speed, devices temperature, voltage inputs, USB devices plugged into the system).
- Filesystems utilization (inodes and blocks).
- Tape drives statistics.
- Average statistics values are calculated over the sampling period
- Most system statistics can be saved in a file for future inspection
- Configurable data history
- On the fly detection of new devices
- Support for UP and SMP machines
- Support for hotplug and tickless CPUs
- 32- or 64-bit architectures
- Needs very little CPU time to run (written in C).
- Export in various different formats (CSV, XML, JSON, etc.)
- Smart color output
- Internationalization support
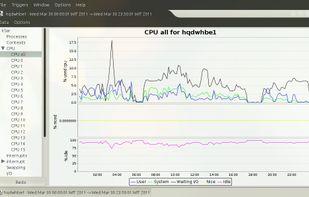
- Many programs available on the internet to use sysstat's data to make graphs (isag is included in sysstat)


