Sysprof
Find and fix performance problems.
Cost / License
- Free
- Open Source (GPL-3.0)
Platforms
- Linux
Features
- Ad-free
- No registration required
- Works Offline
- Employee Performance Management
- Performance Monitoring
Tags
Sysprof information
What is Sysprof?
Find and fix performance problems.
Container Support
Sysprof knows how to introspect into both rootless Podman and Flatpak containers. That means if you have the appropriate debug symbols installed in those containers then Sysprof will show you high-quality symbol names in call stacks.
Callgraphs & Flamegraphs
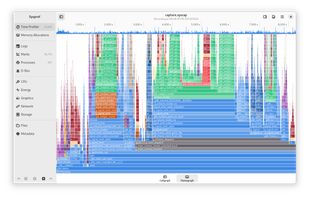
Sysprof can show your call stacks in the form of a traditional callgraph or flamegraph. If your recording contains truncated stack traces then use the bottom-up feature to merge stack frames from the leaves.
Platform Integration
Many GNOME platform libraries contain support for Sysprof which can annotate your recordings with useful information. GLib can export main-loop runtime information. GTK will provide you frame-clock timings and more. The GNOME Shell compositor can provide you information about GPU hardware and frame composition too! Libraries such as Pango and GtkSourceView also provide Sysprof integration.
Application Extensible
Use the sysprof-capture-4.a static-library in your own application to suppliment recording information with marks, counters, meta-data, files, and more!
D-Bus Monitoring
Sysprof can record both the System and User-Session D-Bus. This allows you to view and search across message contents to see what happened. Use the message timing information to dial into what code was running when the messages were sent!
System Counters & Logs
Use the integrated counters for CPU, Energy Usage, Graphics, Network Devices, and Storage Devices to track down when specific problems occur. Systems using journald can have their logs automaticallyforward into the recording.
Scheduler Quanta
Sysprof can record scheduler information for you such as when each process is running on each CPU. Use this to track down latency and threading issues which are holding back application performance.


