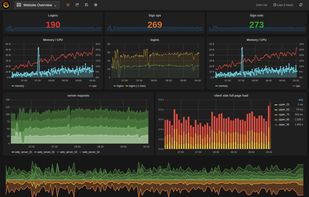
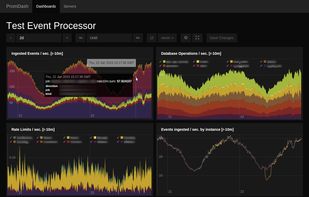
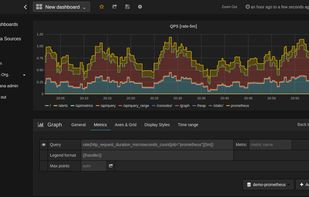
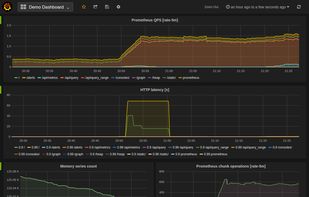
Grafana provides a powerful and elegant way to create, explore, and share dashboards and data with your team and the world.
Platforms
- Mac
- Windows
- Linux
- BSD
- Self-Hosted
- Cloudron
- Docker
- Node.JS
 Sweden
 EU



+1


Apps similar to SenseLogs include Grafana, which is open source with a free version. Other options are Datadog, Kibana, Graylog and Prometheus. Web Log Analyzers like SenseLogs are a crowded field, with more than 50 alternatives for Linux, the web, Windows, Mac and self-hosting.
Grafana provides a powerful and elegant way to create, explore, and share dashboards and data with your team and the world.
SwedenEU
Monitor and visualize your IT and DevOps environments seamlessly with over 120 integrations, enabling real-time insight across on-premise and cloud deployments. Utilize robust analytics, graphing, and correlation tools for error logging and network monitoring. Improve collaboration and proactive IT management.
 United States
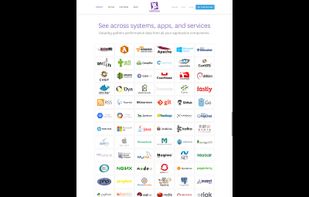
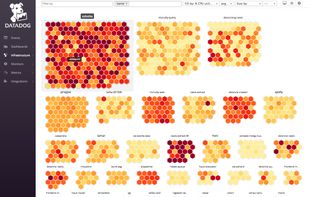
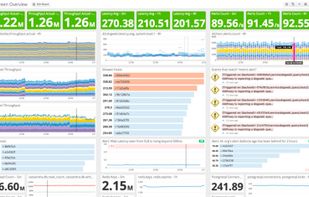
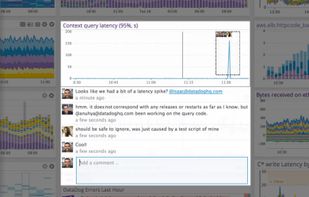


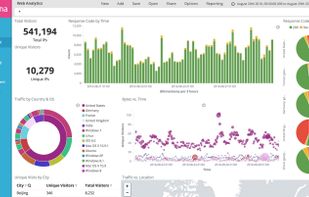
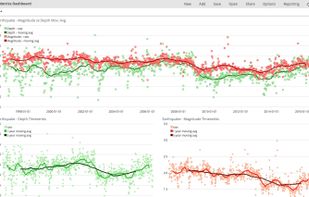
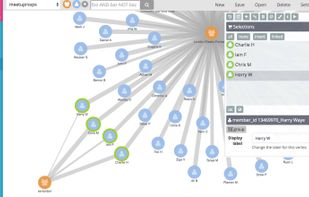
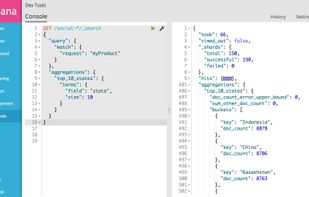
Open-source interface for real-time visualization, search, monitoring logs or metrics, anomaly detection, and natural language queries in Elasticsearch, supporting machine learning, automated alerting, threat detection, and integration with tools like Slack and ServiceNow.
 NetherlandsEU


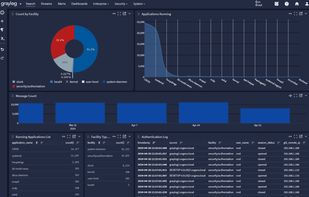
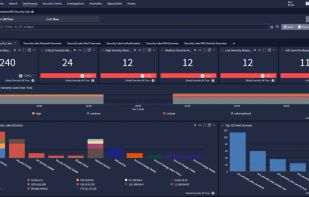
Graylog is a powerful Security Information and Event Management (SIEM) solution offering a robust log analytics platform that simplifies the collection, search, analysis, and alerting of all types of machine-generated data.
United States


Prometheus is an open-source systems monitoring and alerting toolkit originally built at SoundCloud. Since its inception in 2012, many companies and organizations have adopted Prometheus, and the project has a very active developer and user community.


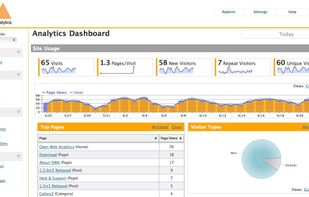
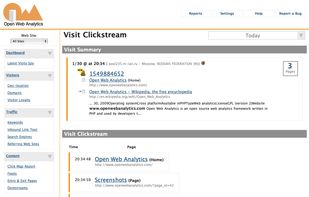
Open Web Analytics - Web Analytics – Open Source Web Analytics Framework
The Open Web Analytics (OWA) framework provides a generic set of PHP and HTTP APIs that application developers can use to integrate web analytics into any application. The Framework also has built-in suppor.
 Norway



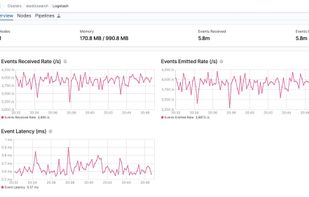
Logstash is an open source, server-side data processing pipeline that ingests data from a multitude of sources simultaneously, transforms it, and then sends it to your favorite "stash.".
NetherlandsEU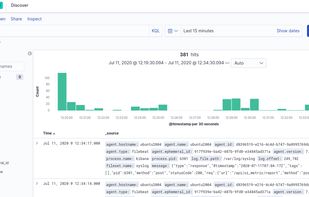
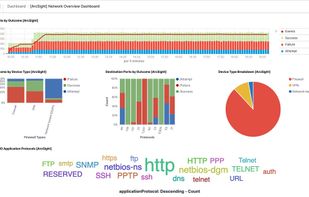


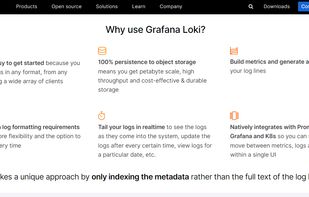
Grafana Loki is a horizontally-scalable, highly-available, multi-tenant log aggregation system inspired by Prometheus. It is designed to be very cost effective and easy to operate. It does not index the contents of the logs, but rather a set of labels for each log stream.
SwedenEU


Splunk is software that provides unique visibility across your entire IT infrastructure from one place in real time. Only Splunk enables you to search, report, monitor and analyze streaming and historical data from any source.
United States


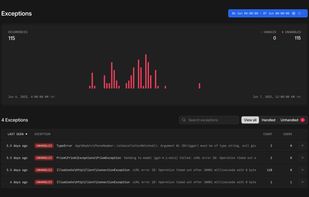
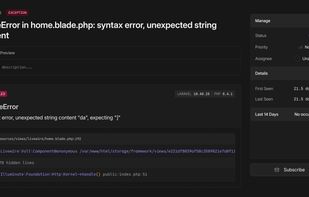
Tracks event timelines, grouped exception alerts, log searches, SQL query and job performance, third-party integrations, notifications, cache patterns, and scheduled tasks across any Laravel deployment, offering comprehensive health insights and instant setup.
United States


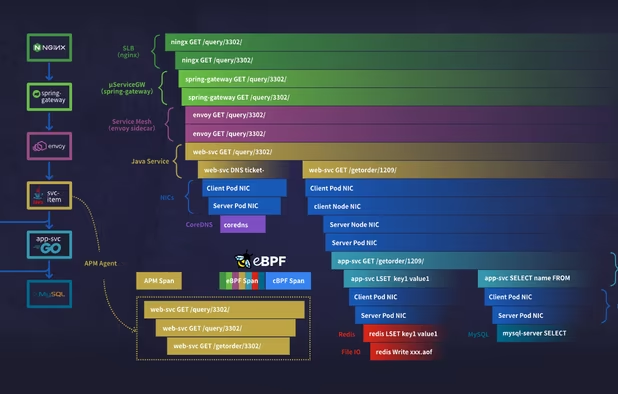
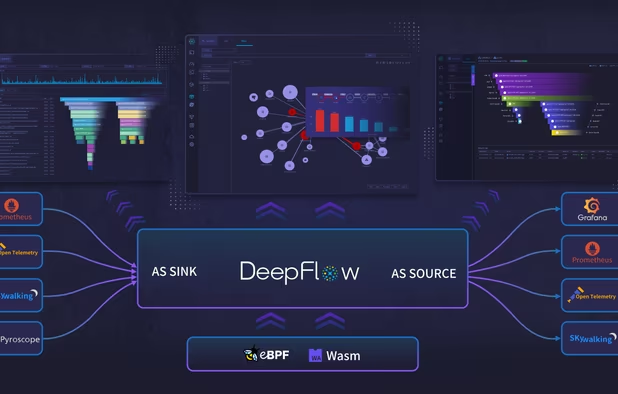
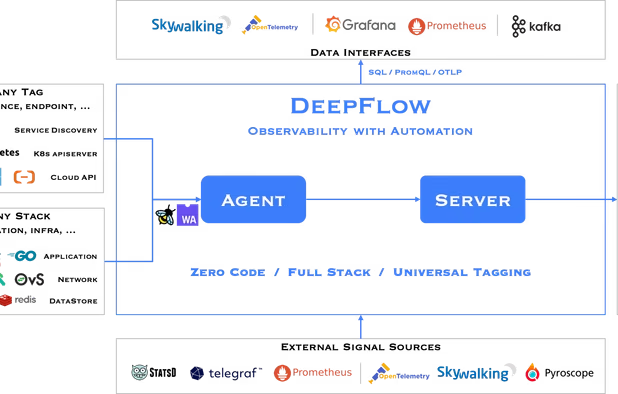
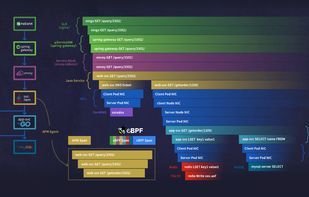
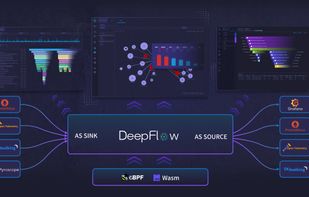
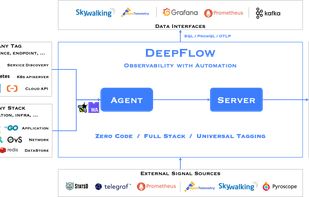
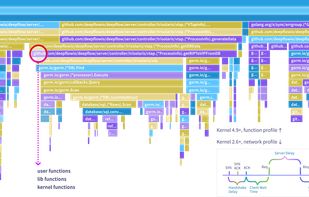
Unify your cloud-native monitoring with zero-code eBPF, advanced profiling, and 10x storage efficiency.
 China


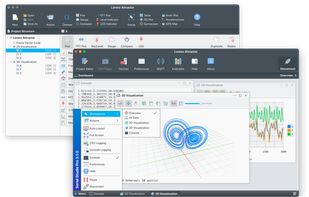
Serial Studio is an open-source, cross-platform telemetry dashboard and real-time data visualization tool. It supports input from serial ports, Bluetooth Low Energy (BLE), and TCP/UDP sockets. It's ideal for embedded devices, external tools, and network services.
 Mexico