SciDaVis Alternatives
SciDaVis is described as 'SciDAVis is a free application for Scientific Data Analysis and Visualization. It's an application aimed at data analysis and' and is an app in the education & reference category. There are more than 25 alternatives to SciDaVis for a variety of platforms, including Windows, Mac, Linux, Web-based and iPad apps. The best SciDaVis alternative is Matplotlib, which is both free and Open Source. Other great apps like SciDaVis are GeoGebra, GnuPlot, LabPlot and Graph.
Alternatives list

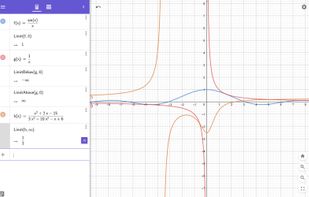
Free online algebra calculator from GeoGebra: solve equations, expand and factor expressions, find derivatives and integrals
Cost / License
- Free
- Open Source
Platforms
- Mac
- Windows
- Online
- Android
- iPhone
- Android Tablet
- iPad


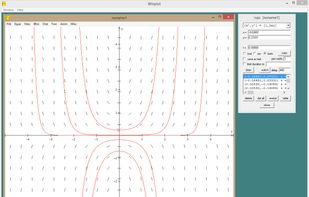
"Winplot is a free graphing utility that was written by Richard Parris, a math instructor at Phillips Exeter Academy in Exeter, New Hampshire. Sadly Richard passed away in 2012. After Richard's death the program was still available for a number of years on the Exeter...
Cost / License
- Free
- Proprietary
Platforms
- Windows


Technical graphing and data analysis for Macintosh and Windows. IGOR Pro creates publication quality scientific graphics used by scientists and engineers around the world. IGOR Pro 6 is an extraordinarily powerful and extensible scientific graphing, data analysis, image...
Cost / License
- Paid
- Proprietary
Platforms
- Mac
- Windows


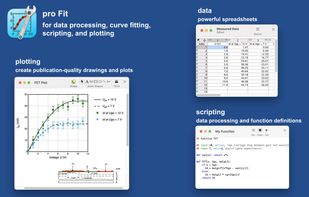
pro Fit, the best curve fitting, regression, plotting, data analysis for macOS. Python and LaTeX support, publication quality plots.
Cost / License
- Freemium
- Proprietary
Platforms
- Mac


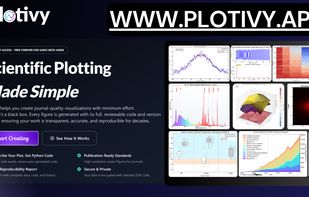
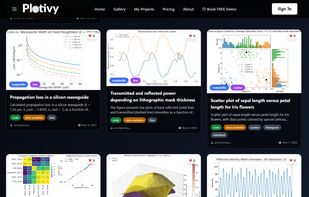
Plotivy is a modern, AI-assisted platform designed specifically for scientific data visualization and image analysis. Built by an experimental physicist for researchers who want to focus on science rather than wrestling with plotting libraries.
Cost / License
- Free
- Proprietary
Platforms
- Online
- Software as a Service (SaaS)
 +4
+4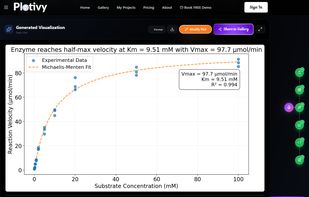


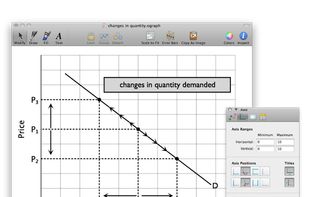
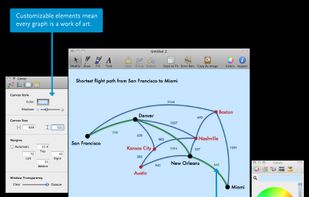
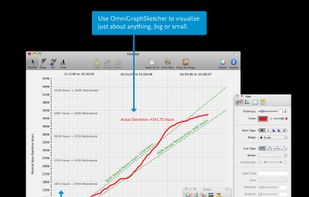
OmniGraphSketcher helps you make elegant and precise graphs in seconds, whether you have specific data to visualize or you just have a concept to explain. Specifically designed for reports, presentations, and problem sets where you need to produce sharp-looking graphs on the...
Cost / License
- Free
- Open Source
Alerts
- Discontinued
Platforms
- Mac
- iPad
 +7
+7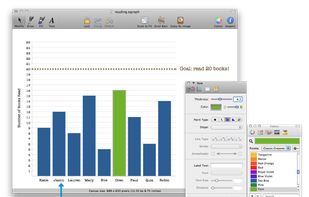


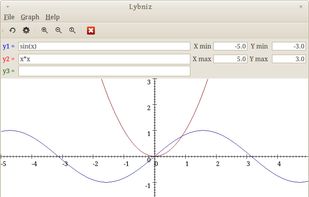
Lybniz is a simple and very easy to use mathematical function graph plotter written in Python and GTK. Expressions are entered in Python syntax.
Cost / License
- Free
- Open Source
Platforms
- Windows
- Linux


Cost / License
- Paid
- Proprietary
Platforms
- Mac
- Windows

 34 MagicPlot alternatives
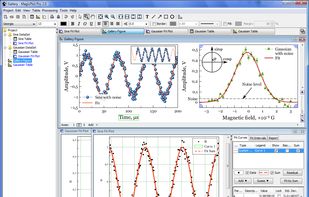
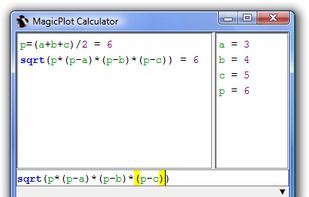
MagicPlot is cross-platform application for scientific and engineering plotting, non-linear and multipeak curve fitting and batch processing. MagicPlot produces high-quality plots and offers handy plot navigation. Project files have .mppz extention.
Cost / License
- Freemium
- Proprietary
Platforms
- Mac
- Windows
- Linux

 +3
+3


Core Plot is a 2D plotting framework for Mac OS X and iOS. It is highly customizable and capable of drawing many types of plots
Cost / License
- Free
- Open Source
Platforms
- Mac
- iPhone
- iPad


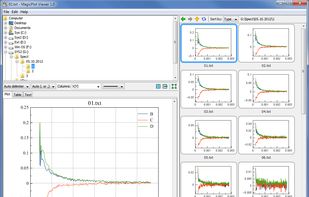
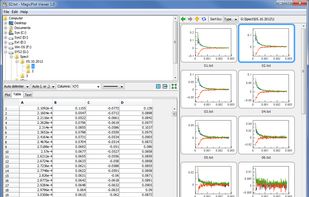
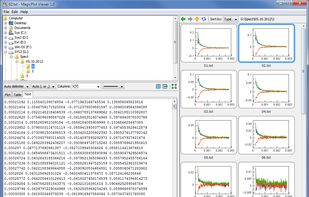
MagicPlot Viewer is a unique cross-platform application for viewing plots and thumbnails from multiple text/ASCII files.
Cost / License
- Paid
- Proprietary
Platforms
- Mac
- Windows
- Linux