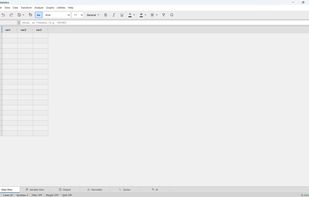
SAI Statistics combines ready-made statistics menus running on the real R engine with the ease of a spreadsheet. The optional AI assistant, SAI, helps you from choosing a test to interpreting the results.
• Spreadsheet-Style Data Entry — type directly into the grid, copy and paste, or import your CSV/Excel files. Column types are detected automatically; no formulas to learn.
• Real R Engine — every calculation runs on real R in the background; results consistent with the literature that you can cite with confidence in academic publications.
• Ready-Made Analysis Menus — independent/paired t-test, one-way and factorial ANOVA, linear & logistic regression, Pearson/Spearman correlation, Mann-Whitney, Kruskal-Wallis, Cronbach's alpha reliability and more — no coding required.
• SAI AI Assistant (optional) — no need to know which test to choose; SAI checks assumptions, suggests tests and interprets results in academic format.
• Live Normality Panel — automatically scans all scale variables: Shapiro-Wilk, SPSS-compatible Lilliefors-corrected Kolmogorov-Smirnov, skewness/kurtosis z-scores and a 4-plot diagnostic panel (Histogram, Q-Q, Detrended Q-Q, Boxplot).
• APA-style reporting and high-resolution chart export.
Get results in three steps: paste/import your data → pick a test from the menu → copy the result straight into your thesis (optionally with SAI's plain-language interpretation).
Pricing
SAI Statistics is free to download and use. All statistical analyses, data management and charts work without an account or payment. The optional AI assistant can be used in two ways:
• With a SAI account — requires a free account; new accounts receive free trial SAI Tokens, and additional SAI Token packs are purchased on our website (one-time purchases, no subscription).
The AI assistant can be turned off completely; all other features remain free.







 SAI-Developer added SAI Statistics as alternative to R (programming language), RStudio, PSPP, JASP and 47 more
 SAI Bilisim


No comments or reviews, maybe you want to be first?