





Reach Reporting
1 like
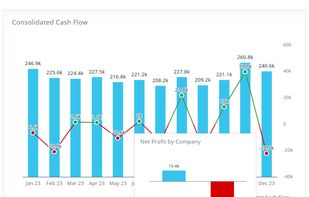
Reach Reporting automates financial reporting and planning, turning accounting data from QuickBooks, Xero, Excel, and Google Sheets into clear, client-ready reports, dashboards, budgets, and forecasts in just a few clicks.

Cost / License
- Freemium (Subscription)
- Proprietary
Platforms
- Online


Features
Reach Reporting News & Activities
Highlights All activities
Recent activities
- ltolentino23 A comment was removed from Reach Reporting
- ltolentino23 liked Reach Reporting
 Mauricio B. Holguin added Reach Reporting as alternative to Jirav and gini
- ltolentino23 added Reach Reporting
 ltolentino23 added Reach Reporting as alternative to Fathom and Syft Analytics


Reach Reporting information
Developed by
 Reach Reporting
 Licensing
Proprietary and Freemium product.Pricing
Subscription ranging between $149 and $550 per month + free version with limited functionality.Alternatives
4 alternatives listedBadge
Get an embeddable badge for Reach ReportingSupported Languages

No comments or reviews, maybe you want to be first?