Mothership provides a way for you to schedule automated backups and then sync with those backups in your local development environment as well as collect applications logs and ping your website regularly to ensure it is rendering.


+1

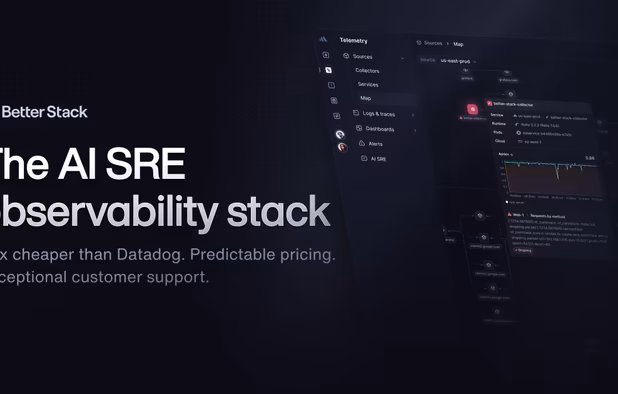
Prometheus is described as 'Open-source systems monitoring and alerting toolkit originally built at SoundCloud. Since its inception in 2012, many companies and organizations have adopted Prometheus, and the project has a very active developer and user community' and is an app in the network & admin category. There are more than 50 alternatives to Prometheus for a variety of platforms, including Web-based, Linux, SaaS, Self-Hosted and Windows apps. The best Prometheus alternative is Datadog. It's not free, so if you're looking for a free alternative, you could try Better Stack or HyperDX. Other great apps like Prometheus are Graylog, Splunk, Grafana Loki and InfluxDB.
Mothership provides a way for you to schedule automated backups and then sync with those backups in your local development environment as well as collect applications logs and ping your website regularly to ensure it is rendering.
VividCortex is the best way to improve your database performance, efficiency, and uptime. Most app performance issues originate in the database, but engineering teams lack visibility into the data tier.


Fluentd is a fully free and open-source log management tool that simplifies your data collection and storage pipeline. It eliminates the need to maintain a set of ad-hoc scripts.
Seq is a self-hosted server application used to collect and search application log events. Its deeply-integrated query language and JSON-focused data model intended to scale smoothly from simple log searches to complex diagnostic and analytic tasks.


DalmatinerDB is a metric database written in Erlang. It takes advantage of special properties of metrics to make trade-offs. The goal is to make a store for metric data (time, values) that is fast, has a low overhead, and is easy to query and manage.


Log aggregation, search, analysis, dashboards & alerts all in one tool. Diagnose server issues faster and on one screen.
QuestDB is a relational column-oriented database designed for time series and event data. It uses SQL with extensions for time series to assist with real-time analytics.


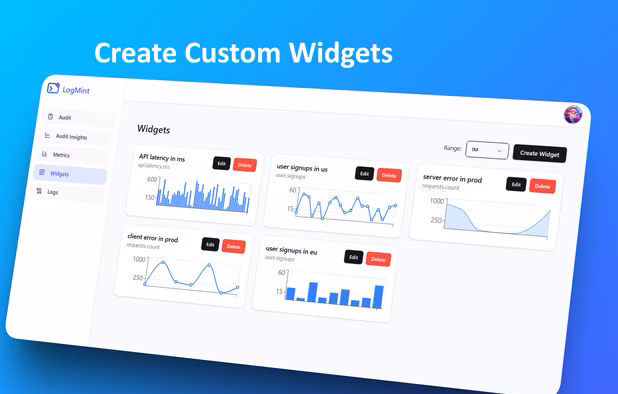
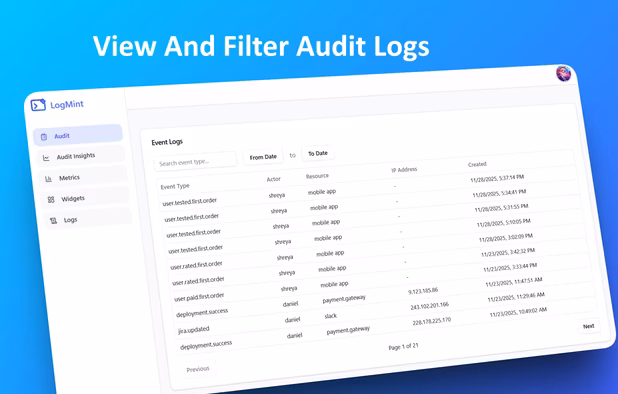
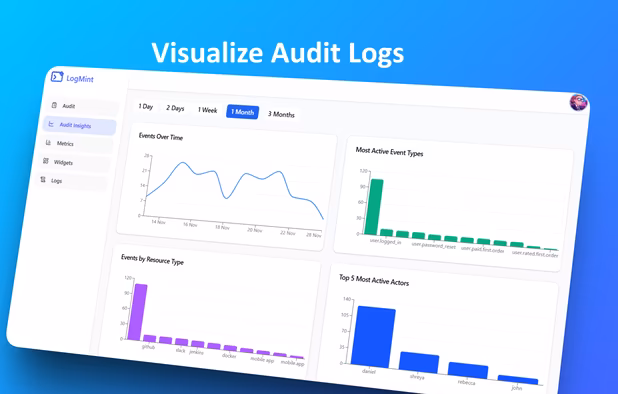
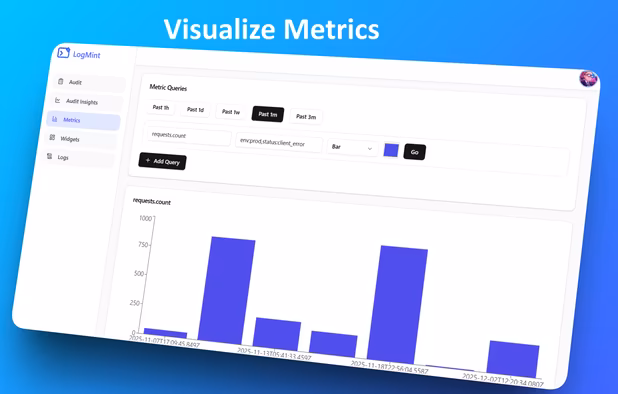
LogMint is a lightweight observability platform for SaaS developers and startups. Track logs, metrics, audit events, dashboards, and alerts all from a single SDK.

Monometric.IO is a monitoring platform for your IT infrastructure. Monitor all critical aspects of your server and/or cloud infrastructure with highly customizable dashboards, alerts and detailed inventory overview.


SenseLogs is designed to extract value from CloudWatch log data without adding complexity and delay. It is up to 10x faster than enterprise services or CloudWatch alone. How do we do it? By uniquely caching everything locally, and eliminating the minutes-long delays imposed by...