

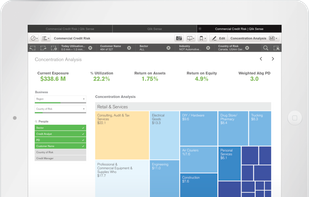
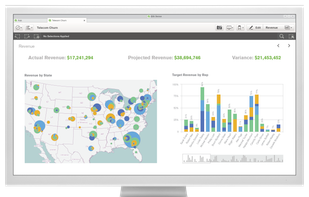
Tableau helps the world’s largest organizations unleash the power of their most valuable assets: their data and their people.
Cost / License
- Paid
- Proprietary
Application type
Platforms
- Mac
- Windows
- Online
- Self-Hosted
+9


There are many alternatives to Microsoft Power BI as a web app if you are looking for a replacement. The best Online alternative is Tableau. It's not free, so if you're looking for a free alternative, you could try Pretzel or Manaflow Bin. If that doesn't suit you, our users have ranked more than 100 alternatives to Microsoft Power BI and loads of them are available as a web app so hopefully you can find a suitable replacement. Other interesting Online alternatives to Microsoft Power BI are Redash, QlikView, RATH and Whatagraph.
Tableau helps the world’s largest organizations unleash the power of their most valuable assets: their data and their people.

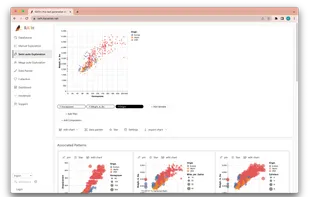
Pretzel is an open-source, offline browser-based tool for fast and intuitive data exploration and visualization. It can handle large data files, runs locally in your browser, and requires no backend setup.


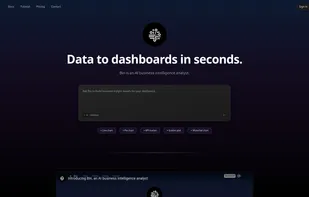
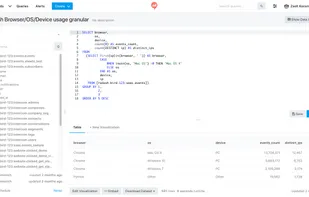
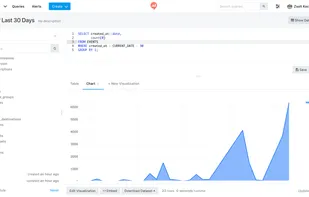
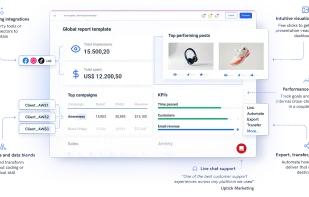
Transforming data to dashboards in seconds, this AI-powered business intelligence tool enables analysts, consultants, and data science teams to rapidly generate visuals, reports, and insights without SQL queries, enhancing collaboration and decision-making across teams.


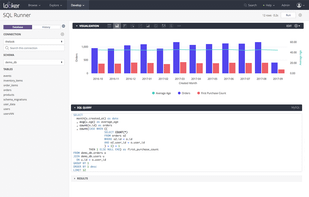
Redash helps you make sense of your data. Connect and query your data sources, build dashboards to visualize data and share them with your company.


QlikView is Qlik’s classic analytics solution for rapidly developing highly-interactive guided analytics applications and dashboards, delivering insight to solve business challenges.


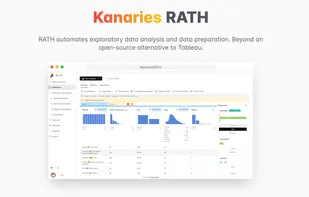
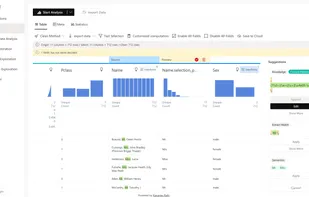
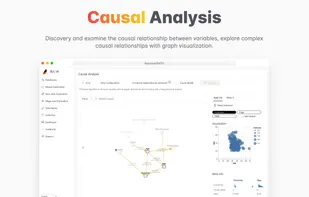
RATH is beyond an open-source alternative to Data Analysis and Visualization tools such as Tableau. It automates your Exploratory Data Analysis workflow with an Augmented Analytic engine by discovering patterns, insights, causals and presents those insights with powerful...


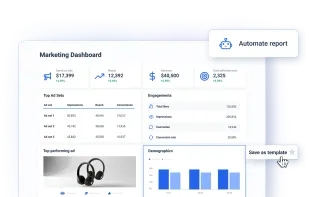
Whatagraph automates analytics reporting process by collecting data from marketing channels and presenting it as visual infographic reports. Reports are automatically generated and delivered to selected e-mail addresses.


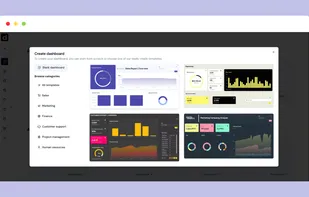
Looker gives you access to your organization’s data. Many users start by browsing through the reports - which we call “Looks” - and dashboards that others in their organization have already created. This page will show you how to get started browsing.


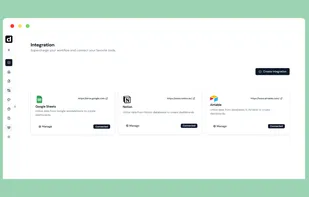
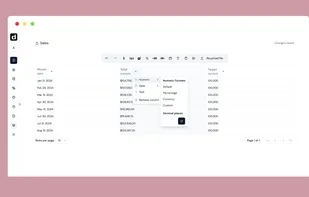
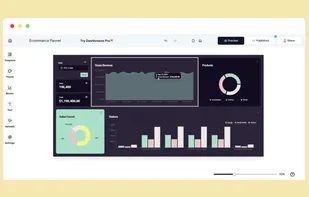
Dashbreeze is a powerful yet user-friendly dashboard-building platform designed to simplify data visualization and empower users to make informed decisions.


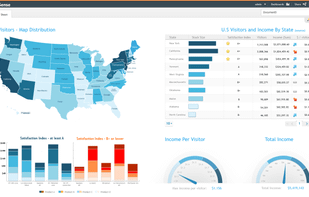
Sisense is a business intelligence and data analytics software that lets non-techies join, analyze, and visualize multiple large data sets in interactive dashboards.


A global leader in business intelligence technology, MicroStrategy provides integrated reporting, analysis, and monitoring software that enables companies to analyze the data stored across their enterprise to make better business decisions.


