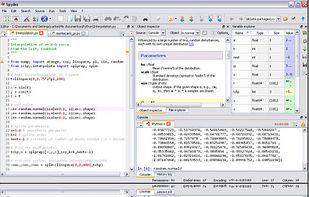


Matplotlib is a comprehensive library for creating static, animated, and interactive visualizations in Python. Matplotlib makes easy things easy and hard things possible.
Cost / License
- Freemium
- Open Source
Since
- Since 2010
 United States


+1


There are many alternatives to OriginPro for Windows if you are looking for a replacement. The best Windows alternative is Matplotlib, which is both free and Open Source. If that doesn't suit you, our users have ranked more than 50 alternatives to OriginPro and many of them are available for Windows so hopefully you can find a suitable replacement. Other interesting Windows alternatives to OriginPro are GnuPlot, LabPlot, Plotly and Minitab.
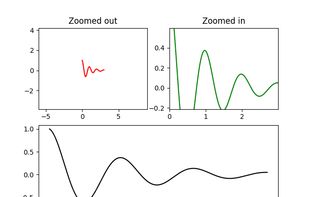
Matplotlib is a comprehensive library for creating static, animated, and interactive visualizations in Python. Matplotlib makes easy things easy and hard things possible.
United States
Gnuplot is a portable command-line driven interactive data and function plotting utility. It was originally intended as to allow scientists and students to visualize mathematical functions and data. It does this job pretty well, but has grown to support many non-interactive...


LabPlot is a free, open source and cross-platform Data Visualization and Analysis software accessible to everyone and trusted by professionals.
 Germany
 EU


Plotly is the easiest way to graph and share data online. Open-source libraries for JavaScript (comparison with HighCharts at https://plot.ly/highcharts-alternative/), Python, R, and MATLAB.
United States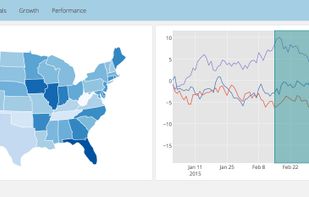
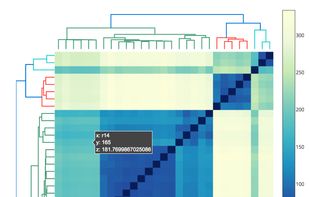
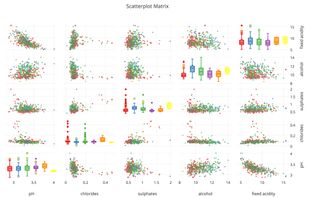


Minitab is a comprehensive statistical software package designed for analyzing data in Lean Six Sigma and statistics education, offering tools for quality and process improvement, making it ideal for various educational and professional uses.
United States


GraphPad Prism is a powerful combination of basic biostatistics, curve fitting and scientific graphing in one comprehensive program. More than 100,000 scientists in over 100 countries rely on Prism to analyze, graph and present their scientific data.
United States


SciDAVis is a free application for Scientific Data Analysis and Visualization. It's an application aimed at data analysis and


QtiPlot is a professional scientific data analysis and visualisation solution. It is meant to be a cheap alternative to proprietary and costly software such as Origin, SigmaPlot, Regressi or Igor Pro.
 RomaniaEU


Technical graphing and data analysis for Macintosh and Windows. IGOR Pro creates publication quality scientific graphics used by scientists and engineers around the world. IGOR Pro 6 is an extraordinarily powerful and extensible scientific graphing, data analysis, image...


SigmaPlot is a proprietary software package for scientific graphing and data analysis for Microsoft Windows. The software can read multiple formats and perform mathematical transforms and statistical analyses.
United States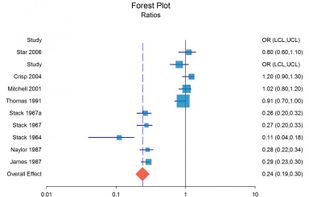
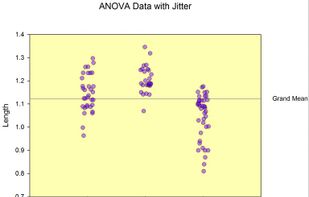
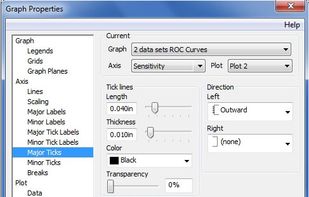


Graph is an open source application used to draw mathematical graphs in a coordinate system. Anyone who wants to draw graphs of functions will find this program useful. The program makes it very easy to visualize a function and paste it into another program.


Python(x,y) is a free scientific and engineering development software for numerical computations, data analysis and data visualization based on Python programming language, Qt graphical user interfaces and .
 FranceEU