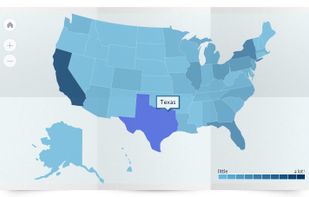
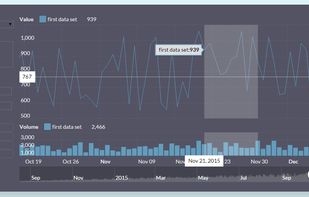
26+ well-designed, themeable, responsive, modular, real-time and easy to use charts and 109+ maps.
Cost / License
- Free
- Open Source
Application type
Platforms
- Mac
- Windows
- Linux
- Online
- Android
- iPhone
- iPad
 India
India
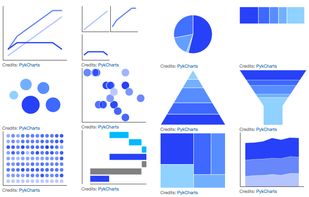


Apps similar to NVD3 include RAWGraphs, which is free and open source. Other options are D3.js, Tableau, Plotly and Google Charts. There's no shortage of Charting Library Tools like NVD3, with more than 50 alternatives for the web, self-hosting, Windows, Mac and Linux.
26+ well-designed, themeable, responsive, modular, real-time and easy to use charts and 109+ maps.
India
Datamatic is like WordPress for data visualizations, it offers 70+ interactive data visualization templates, Excel-like data editor & beautiful material design styles. Data visualizations can be easily embedded in any website or web application.
 Czechia
 EU
EU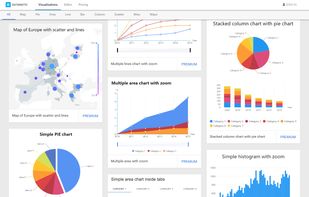


Vega-Lite provides a higher-level grammar for visual analysis, comparable to ggplot or Tableau, that generates complete Vega specifications. Vega-Lite specifications consist of simple mappings of variables in a data set to visual encoding channels such as x, y, color, and size.
 United States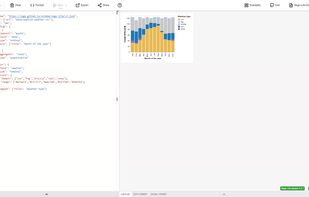


Flowtrail AI a Conversational AI analyst who will generate reports for you through a conversation with your data. Easily create insightful reports and dashboards from multiple databases, without the need for SQL expertise.
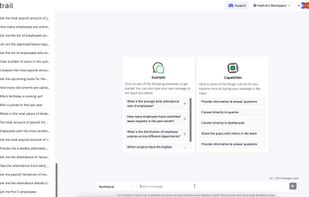
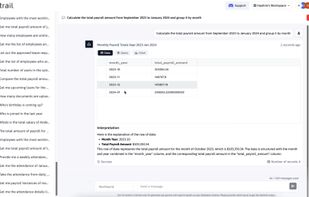
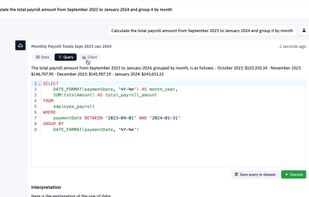
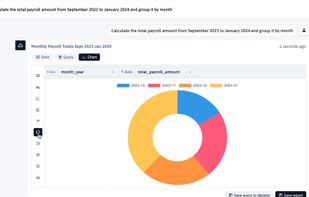


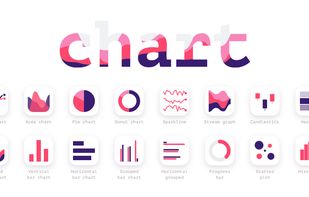
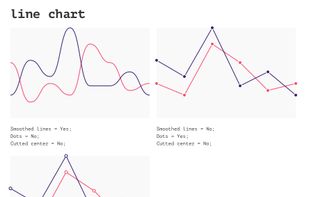
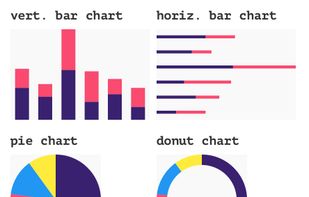
Chart is a plugin for Sketch, Figma, and Adobe XD. Try Chart to save yourself hours of manual, tedious work, and create a graph with real or random data in seconds. It's easy to make, edit, and customize different types of graphs.


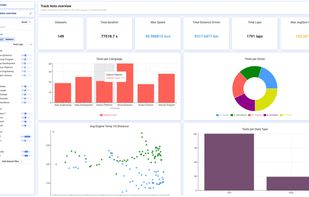
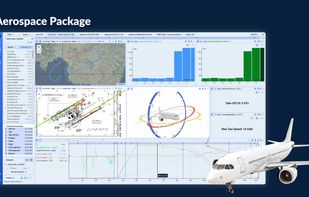
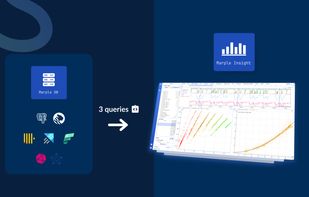
Marple Insight offers powerful tools for interactive analysis of high-frequency time-series data. Engineers and scientists from automotive, aerospace and manufacturing use it to explore, visualise, and analyse sensor or test data.
 BelgiumEU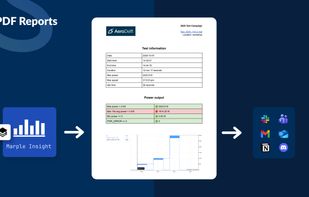


Bokeh is a Python interactive visualization library that targets modern web browsers for presentation. Its goal is to provide elegant, concise construction of novel graphics in the style of D3.js, but also deliver this capability with high-performance interactivity over very...


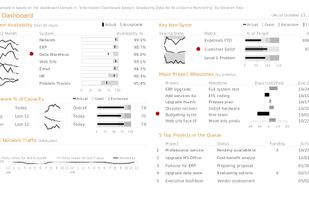
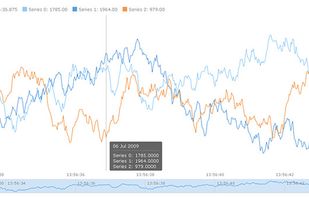
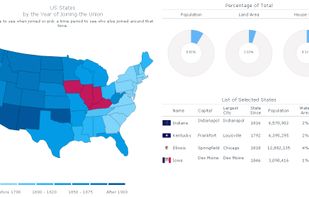
Flexible, cross-platform and cross-browser JavaScript (HTML5) charting library that allows you to create interactive bar, pie, line, spline, area, Gantt, stock and other charts, maps and dashboards, with real-time updates and multi-level drill-downs.
United States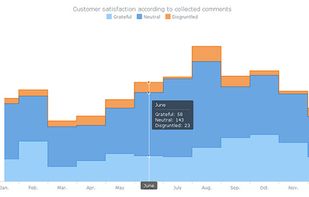


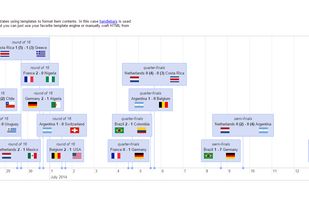
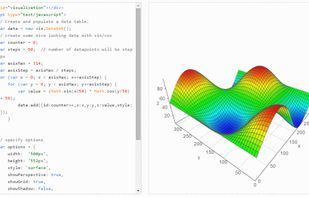
vis.js is a dynamic, browser based visualization library. The library is designed to be easy to use, to handle large amounts of dynamic data, and to enable manipulation of and interaction with the data.
 NetherlandsEU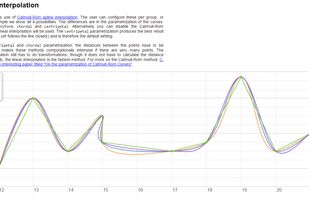

D3-based reusable chart library that enables deeper integration of charts into web applications
 Japan
Japan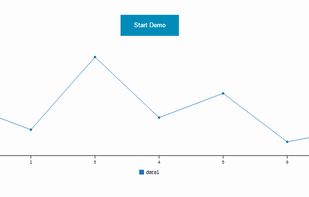

dc.js is a JavaScript charting library with native Crossfilter support and allowing highly efficient exploration on large multi-dimensional dataset (inspired by Crossfilter 's demo). It leverages d3 engine to render charts in CSS friendly SVG format. Charts rendered using dc.
United States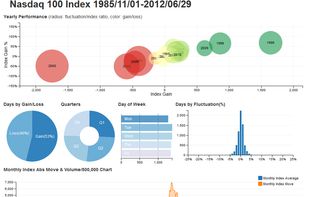


amCharts is an advanced charting library that will suit any data visualization need. Our charting solution include Column, Bar, Line, Area, Step, Step without risers, Smoothed line, Candlestick, OHLC, Pie/Donut, Radar/ Polar, XY/Scatter/Bubble, Bullet, Funnel/Pyramid charts as...
United States