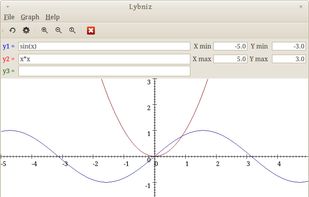
Lybniz is a simple and very easy to use mathematical function graph plotter written in Python and GTK. Expressions are entered in Python syntax.
Cost / License
- Free
- Open Source
Platforms
- Windows
- Linux


Apps similar to NumeRe include LibreOffice, which is free and open source. Other options are LibreOffice - Calc, Microsoft Excel, Proton Sheets and Google Sheets. You're spoiled for choice with Spreadsheet Apps like NumeRe: we list more than 50 alternatives for Windows, Linux, Mac, the web and Android.
Lybniz is a simple and very easy to use mathematical function graph plotter written in Python and GTK. Expressions are entered in Python syntax.

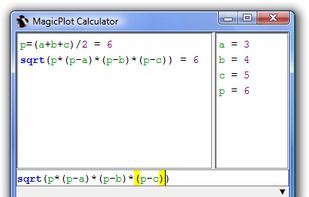
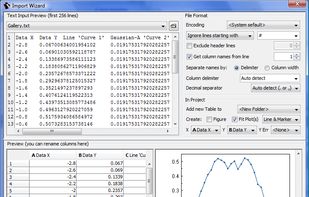
MagicPlot is cross-platform application for scientific and engineering plotting, non-linear and multipeak curve fitting and batch processing. MagicPlot produces high-quality plots and offers handy plot navigation. Project files have .mppz extention.
 United States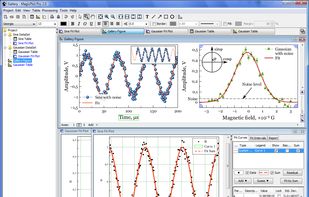


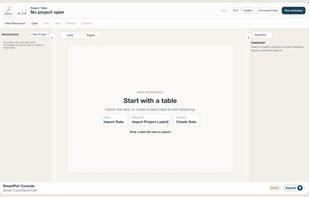
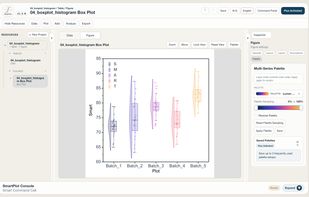
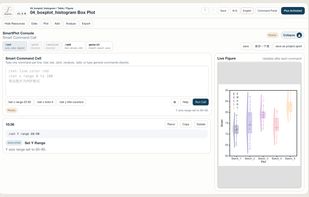
SmartPlot is a desktop scientific plotting and data analysis application designed for researchers who want a direct workflow from data tables to editable, publication-ready figures.
 Hong Kong SAR China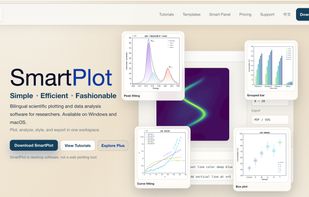


KaleidaGraph, the daily workhorse for graphing and data analysis.
KaleidaGraph contains the comprehensive toolset you need to get your graphing and data analysis done quickly and easily. Period. No costly "bells and whistles" that you rarely use. No complicated softwa.
United States


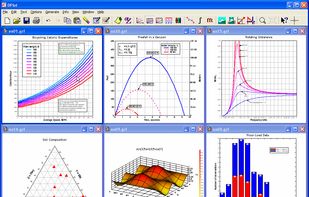
DPlot graphing software lets scientists and engineers graph, plot, analyze, and manipulate data.


 United Kingdom


Core Plot is a 2D plotting framework for Mac OS X and iOS. It is highly customizable and capable of drawing many types of plots


DataMelt (or DMelt) is a program for numeric computation, statistics, data analysis and data visualization.
United States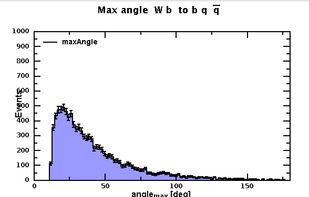
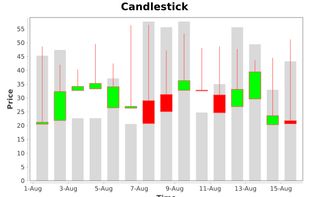
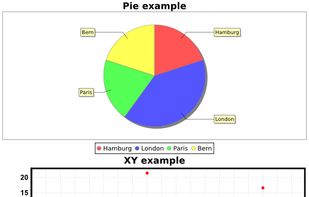


Aveloy Graph is an application for graph creation / data visualization - fast, easy to use and interactive.
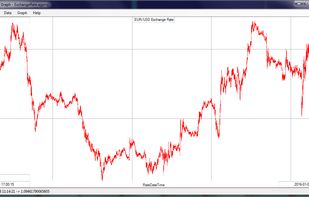
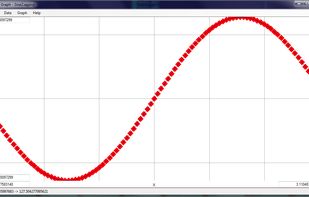


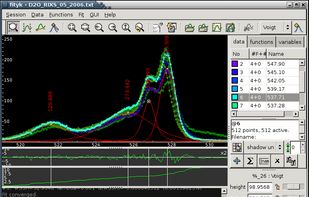
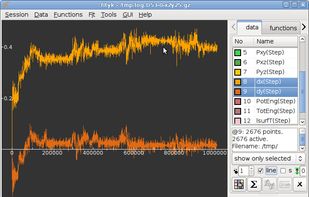
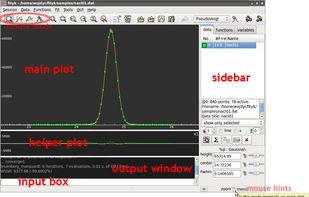
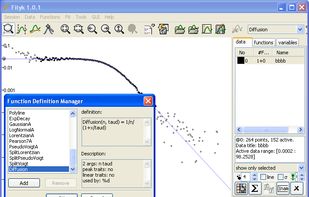
Fityk is a curve fitting and data analysis application, predominantly used to fit analytical, bell-shaped functions to experimental data. It is positioned to fill the gap between general plotting software and programs specific for one field, e.g. crystallography or XPS.


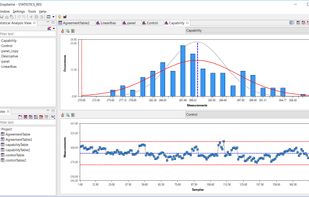
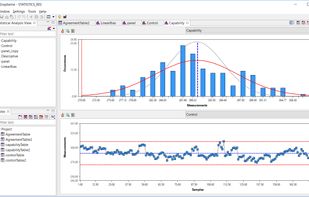
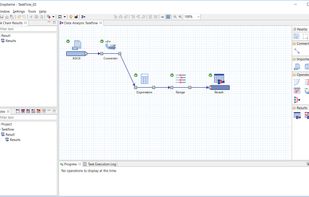
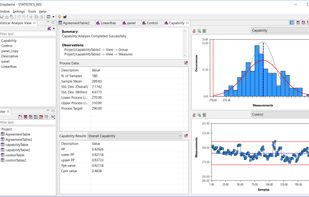
Grapheme is an intuitive and powerful data visualization and analysis tool. Grapheme brings you advanced data analysis capabilities along with interactive plotting functionalities to enable exploring and understanding complex sets of data.


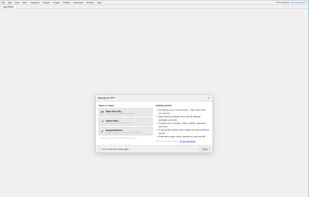
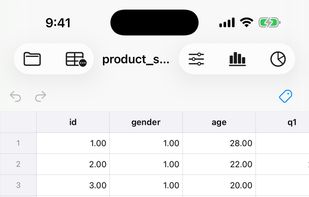
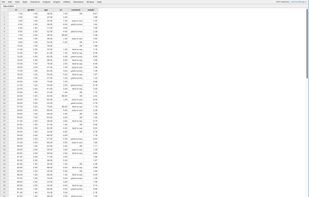
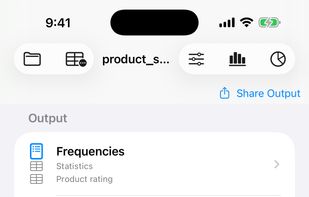
TRTT is a statistical analysis application that opens, edits and saves SPSS .sav and .zsav data files. It runs as a web app in the browser, with all computation done client-side via WebAssembly, and as a native iPhone/iPad app that shares the same analysis engine, so results are...
 Poland
 EU
EU