Highcharts Alternatives
Highcharts is described as 'Charting library written in pure JavaScript, offering an easy way of adding interactive charts to your web site or web application. Highcharts currently supports line, spline, area, areaspline, column, bar, pie and scatter chart types' and is a charting library tool in the development category. There are more than 50 alternatives to Highcharts for a variety of platforms, including Web-based, Self-Hosted, Mac, Windows and Linux apps. The best Highcharts alternative is D3.js, which is both free and Open Source. Other great apps like Highcharts are RAWGraphs, Plotly, Google Charts and Apache Echarts.
Alternatives list

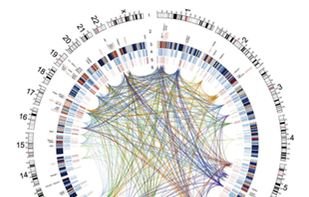
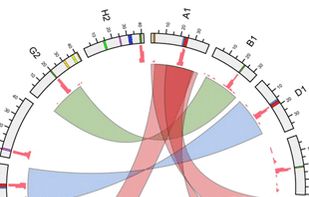
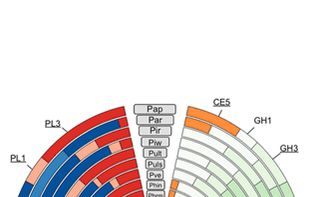
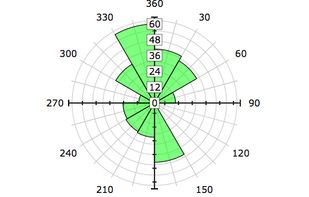
Circos is a software package for visualizing data and information. It visualizes data in a circular layout — this makes Circos ideal for exploring relationships between objects or positions. There are other reasons why a circular layout is advantageous, not the least being the...
 +9
+9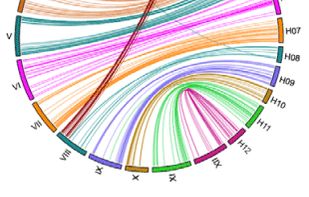


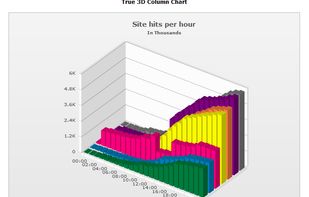
A collection of Flash applets that you embed in your web page, and which fetch data from the web server to display.
Cost / License
- Free
- Open Source
Platforms
- Mac
- Windows
- Linux


ChartBlocks is an online software platform that lets you quickly and easily build embeddable, shareable charts.


RGraph is a HTML5 canvas graph library. It uses features that became available in HTML5 (specifically, the CANVAS tag) to produce a wide variety of graph types: bar chart, bi-polar chart (also known as an age frequency chart), donut chart, funnel chart, gantt chart, horizontal...
Cost / License
- Free Personal
- Proprietary
Platforms
- Mac
- Windows
- Linux


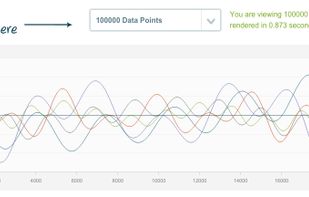
ZingChart is a JavaScript charting library with no dependencies that is built for big data. The library can handle huge data sets without breaking, crashing, or sacrificing interactivity. As a dependency-free library, no additional plugins are required.
 +4
+4

- 25 Flot alternatives
Flot is a pure Javascript plotting library for jQuery. It produces graphical plots of arbitrary datasets on-the-fly client-side.
Cost / License
- Free
- Proprietary
Platforms
- Mac
- Windows
- Linux
- jQuery
 F
F 
FusionCharts Suite XT helps you create interactive JavaScript charts, gauges and maps in a jiffy for all your web, mobile and enterprise applications. Using it, you can build awesome dashboards, reports, analytics, monitors, surveys that blend aesthetic elegance and actionable...
Cost / License
- Paid
- Proprietary
Platforms
- Mac
- Windows
- Linux
- Online
- Android
- iPhone
- Blackberry
- Android Tablet
- iPad


The Syncfusion JavaScript UI controls library is the only suite that you will ever need to build an application since it contains over 60 high-performance, lightweight, modular, and responsive UI components in a single package.
Cost / License
- Paid
- Proprietary
Platforms
- Mac
- Windows
- Linux
 +2
+2


We enhance free or commercial third-party chart products with new features and emulated charts. We feature thousands of almost ready-to-use charts with Google Charts, jqPlot, Highcharts, AnyChart, FusionCharts, amCharts, CanvasJS, Syncfusion, Shield UI, and the Microsoft ASP.
Cost / License
- Paid
- Proprietary
Platforms
- Online
 +5
+5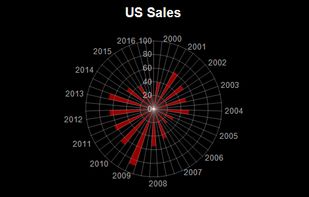


ArcadiaCharts is a premium JavaScript charting library for the usage in web based environments.
Cost / License
- Free
- Proprietary
Platforms
- Online


Performance, better support and community license