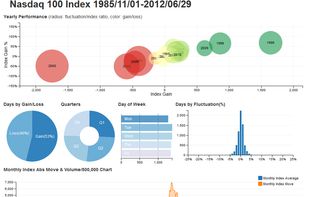
This project is an attempt to build re-usable charts and chart components for d3.js without taking away the power that d3.js gives you. This is a very young collection of components, with the goal of keeping these components very customizeable, staying away from your standard...
FusionCharts Suite XT Alternatives
FusionCharts Suite XT is described as 'Helps you create interactive JavaScript charts, gauges and maps in a jiffy for all your web, mobile and enterprise applications. Using it, you can build awesome dashboards, reports, analytics, monitors, surveys that blend aesthetic elegance and actionable' and is an app in the development category. There are more than 50 alternatives to FusionCharts Suite XT for a variety of platforms, including Web-based, Windows, Self-Hosted, Mac and Linux apps. The best FusionCharts Suite XT alternative is D3.js, which is both free and Open Source. Other great apps like FusionCharts Suite XT are RAWGraphs, Plotly, Google Charts and Apache Echarts.
Alternatives list


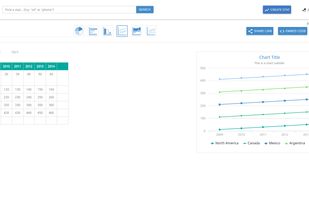
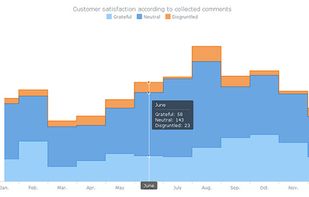
26+ well-designed, themeable, responsive, modular, real-time and easy to use charts and 109+ maps.
Cost / License
- Free
- Open Source
Application type
Platforms
- Mac
- Windows
- Linux
- Online
- Android
- iPhone
- iPad


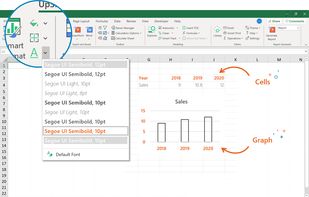
UpSlide plug-in allows you to perform routine Microsoft Excel, Word and PowerPoint tasks 5x faster making productivity gains of 12 hours per month. For example: link Excel to PowerPoint easily, access your up-to-date documents directly from Office...
Cost / License
- Paid
- Proprietary
Platforms
- Software as a Service (SaaS)
 +4
+4

 59 Bokeh alternatives
Bokeh is a Python interactive visualization library that targets modern web browsers for presentation. Its goal is to provide elegant, concise construction of novel graphics in the style of D3.js, but also deliver this capability with high-performance interactivity over very...
Cost / License
- Free
- Open Source
Platforms
- Mac
- Windows
- Linux
- Online


Flexible, cross-platform and cross-browser JavaScript (HTML5) charting library that allows you to create interactive bar, pie, line, spline, area, Gantt, stock and other charts, maps and dashboards, with real-time updates and multi-level drill-downs.
Cost / License
- Paid
- Proprietary
Platforms
- Mac
- Windows
- Linux
- Online
- Android
- iPhone
- Self-Hosted
 +2
+2

 C
C 58 Vis.js alternatives
vis.js is a dynamic, browser based visualization library. The library is designed to be easy to use, to handle large amounts of dynamic data, and to enable manipulation of and interaction with the data.
Cost / License
- Free
- Open Source
Platforms
- Self-Hosted


dc.js is a JavaScript charting library with native Crossfilter support and allowing highly efficient exploration on large multi-dimensional dataset (inspired by Crossfilter 's demo). It leverages d3 engine to render charts in CSS friendly SVG format. Charts rendered using dc.


100% Free Excel Add-In for Waterfall, Gantt, QIGS, Mirror, BubbleX & Double Donut Charts and Live FX Rates. Also features usefull shortcuts and Excel-internal Web Browser. Supports 9 languages (EN,FR,DE,ES,TR,RU,AR,CH,IN).
Cost / License
- Free
- Proprietary
Platforms
- Windows
 +4
+4


Cost / License
- Free
- Proprietary
Platforms
- Online