
Dwarf Debugger
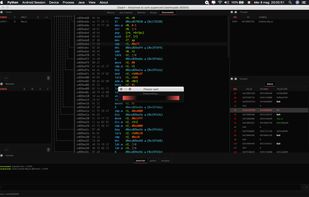
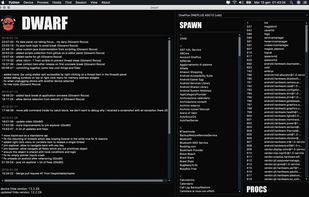
Full featured multi arch/os debugger. The purpose of Dwarf is to simplify tasks while doing reverse engineering, cracking and security analysis on a process running on a mobile phone running either Android or iOS.
Cost / License
- Free
- Open Source (GPL-3.0)
Platforms
- Windows
- Linux
Dwarf Debugger News & Activities
Recent activities
Dwarf Debugger information
What is Dwarf Debugger?
A debugger for reverse engineers, crackers and security analyst. Or you can call it damn, why are raspberries so fluffy or yet, duck warriors are rich as fuck. Whatever you like! Built on top of pyqt5, frida and some terrible code.
Features: Breakpoint native layer on Android and iOS Breakpoint java functions and constructors on Android Breakpoint module load by leaking base on Android (allows early module initialization debugging) Memory watchers for read/write access Expose public js api for runtime/static scripting Allow exploring java classes and object instantiated in runtime when hitting a breakpoint in the java layer Enumeration of ranges, modules, java classes and methods Allow to spawn or inject a process and allow to use custom js panel (see later) Console evaluating js inline or though js panel (see next) JS panel allowing javascript code as evaluated function with shortcuts to load plugins from a “plugin repository on github” or from a file Allow to set condition and logic to each breakpoint if added from UI, otherwise breakpoints could be added also from console with custom callbacks Expose public js api to interact with the UI – send data from js script side to the ui Allow to switch between threads with ease (i.e, more then 1 thread hit breakpoint at memcpy and another one hit a java breakpoint) Backtrace on both native and java layer Any pointer displayed in UI have a context (right click) menu that allows to quickly access to symbols, jump to hex view, disasm, dump memory and so on Hex view and ASM view to lazy populate the whole range of the selected pointer Patch instructions, write bytes and string with ease Export and import back breakpoints Restart and reload the target binary From within the app, on Android only, you can update frida server and dump binaries (apk)


