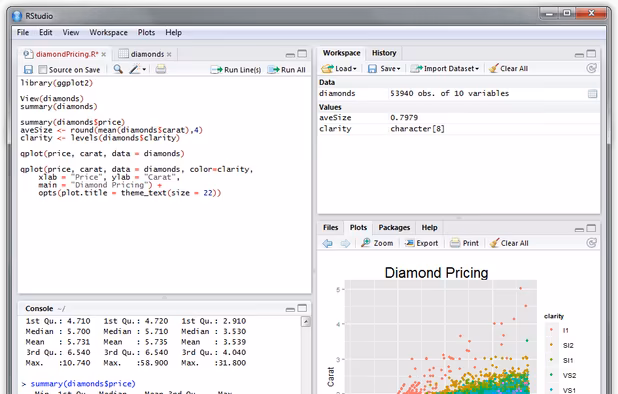
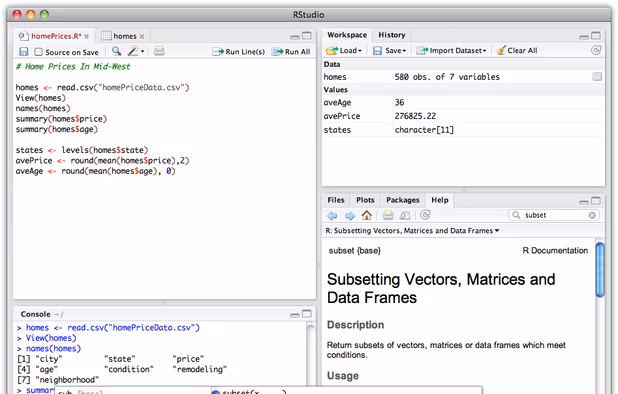
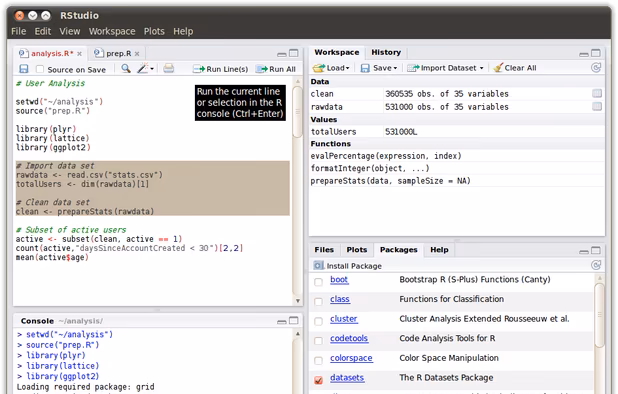
RStudio™ is an integrated development environment (IDE) for R. RStudio combines an intuitive user interface with powerful coding tools to help you get the most out of R.
+1
Displayr is described as 'Is online data science and data analytics software. It was created so smart people could do their own data science: explore, model, visualize and report. One app for everything. Easy for novices, powerful for experts' and is a statistical analyzer in the development category. There are more than 10 alternatives to Displayr, not only websites but also apps for a variety of platforms, including Windows, Linux, Mac and Microsoft Excel apps. The best Displayr alternative is RStudio, which is both free and Open Source. Other great sites and apps similar to Displayr are PSPP, IBM SPSS Statistics, Positron and Stata.
RStudio™ is an integrated development environment (IDE) for R. RStudio combines an intuitive user interface with powerful coding tools to help you get the most out of R.
PSPP is a free software application for analysis of sampled data. It has a graphical user interface and conventional command line interface. It is written in C, uses GNU Scientific Library for its mathematical routines, and plotutils for generating graphs.

The IBM SPSS software platform offers advanced statistical analysis, a vast library of machine-learning algorithms, text analysis, open-source extensibility, integration with big data and seamless deployment into applications.


A free, next-generation data science IDE built by Posit PBC. An extensible, polyglot tool for writing code and exploring data. A familiar environment for reproducible authoring and publishing.

Data Analysis and Statistical Software for Professionals.
Stata is a complete, integrated statistical package that provides everything you need for data analysis, data management, and graphics. Stata is not sold in pieces, which means you get everything you need in one package.


STATISTICA is a tried and true analytics platform with more than two decades of history in delivering successful business results for our customers, a global user base of more than 600,000 users.

Statwing was built by and for analysts, so you can clean data, explore relationships, and create charts in minutes instead of hours. Simply upload your spreadsheet or dataset, then select the relationships you want to explore.


SAS is the leader in business analytics software and services, and the largest independent vendor in the business intelligence market.

Tinn-R, the R code editor Tinn stands for the recursive acronym 'Tinn is not Notepad'. It is initially written as a small ASCII file editor primarily intended as a better replacement for the default Notepad.exe program distributed with Windows. With versions, it grew to a.


MonteCarlito is a free Excel-add-in to do Monte-Carlo-simulations. Apart from these it can also do statistical analysis like mean, median, standard error, variance, skewness, kurtosis. It can create histograms. The code is open source.

Owlytics.ai is an AI-powered market research and business analysis platform that transforms complex strategic analysis into actionable insights — in minutes, not months.

Transforms collected data from Excel and SPSS into visual PowerPoint reports, automates updates with new data, supports advanced charting, conditional analysis, team collaboration, secure sharing, and ensures the latest analytics sync seamlessly with the presentation workspace.


