GeoGebra is free and multi-platform dynamic mathematics software for learning and teaching. It has received several educational software awards in Europe and the USA.
Cost / License
- Free
- Source Available
Since
- Since 2009
 Austria
 EU


+2


GeoGebra is free and multi-platform dynamic mathematics software for learning and teaching. It has received several educational software awards in Europe and the USA.
AustriaEU
Gnuplot is a portable command-line driven interactive data and function plotting utility. It was originally intended as to allow scientists and students to visualize mathematical functions and data. It does this job pretty well, but has grown to support many non-interactive...


Online math solver, equation editor and database, graphing calculator and science/engineering problem helper.
 GermanyEU
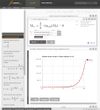
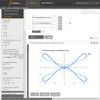
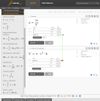


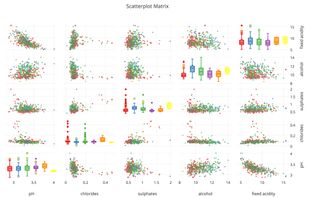
Plotly is the easiest way to graph and share data online. Open-source libraries for JavaScript (comparison with HighCharts at https://plot.ly/highcharts-alternative/), Python, R, and MATLAB.
 United States
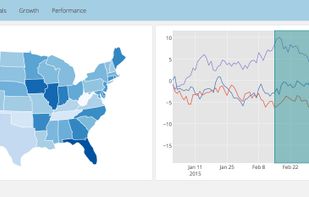
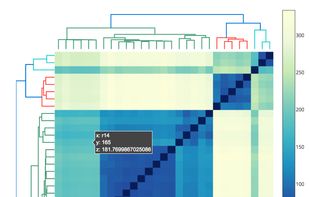


With Grapher, you can graph equations and data sets and visualize the results on your Mac in real time. Grapher displays algebraic relations, both implicit and explicit, in 2D and 3D. You can use a variety of coordinate systems and choose from a wide array of mathematical...
United States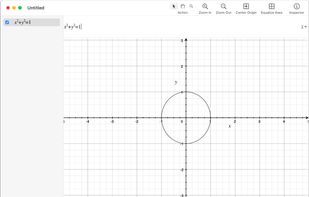


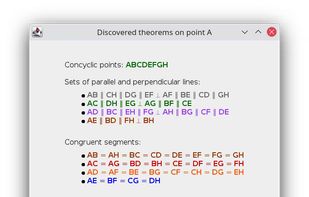
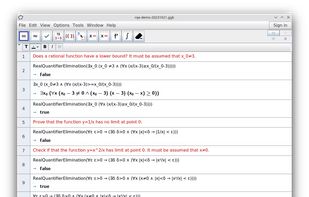
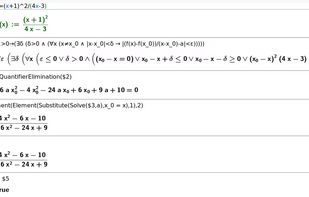
GeoGebra Discovery is an experimental version of GeoGebra. It contains some bleeding edge features of GeoGebra that are under heavy development and therefore not intended for every day use yet, so they are not included in the official GeoGebra version.
AustriaEU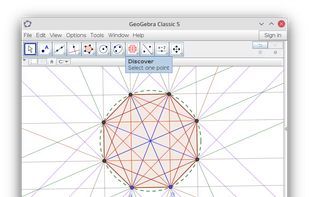


GraphCalc is an all-in-one solution to everything from everyday arithmetic to statistical analysis, from betas to Booleans, from cubes to calculus, from decimals to derivatives. GraphCalc combines all the features of a professional mathematics package with the simplicity of an...


Online calculator tool with 3D graph render, 2D function graphs, scientific calculator and integral calculator.


Easy-to-use platform by Desmos where you can construct shapes and lines, transform shapes and lines, and use other tools such as a compass or have the platform find a midpoint of a certain segment.
United States


"Winplot is a free graphing utility that was written by Richard Parris, a math instructor at Phillips Exeter Academy in Exeter, New Hampshire. Sadly Richard passed away in 2012. After Richard's death the program was still available for a number of years on the Exeter...


Bokeh is a Python interactive visualization library that targets modern web browsers for presentation. Its goal is to provide elegant, concise construction of novel graphics in the style of D3.js, but also deliver this capability with high-performance interactivity over very...


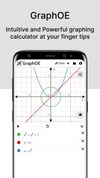
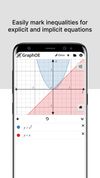
GraphOE is a multi-platform graphing application. It is a useful tool for college/high-school students for their math home works.