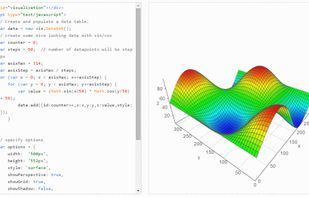
This project is an attempt to build re-usable charts and chart components for d3.js without taking away the power that d3.js gives you. This is a very young collection of components, with the goal of keeping these components very customizeable, staying away from your standard...
dc.js Alternatives
dc.js is described as 'JavaScript charting library with native Crossfilter support and allowing highly efficient exploration on large multi-dimensional dataset (inspired by Crossfilter 's demo). It leverages d3 engine to render charts in CSS friendly SVG format. Charts rendered using dc' and is a charting library tool in the development category. There are more than 25 alternatives to dc.js, not only websites but also apps for a variety of platforms, including Self-Hosted, Mac, Windows and Linux apps. The best dc.js alternative is D3.js, which is both free and Open Source. Other great sites and apps similar to dc.js are Tableau, RAWGraphs, Plotly and Google Charts.
Alternatives list


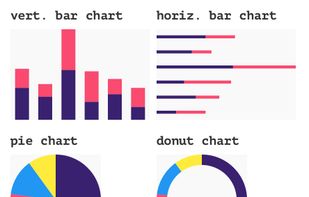
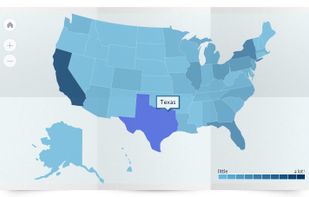
26+ well-designed, themeable, responsive, modular, real-time and easy to use charts and 109+ maps.
Cost / License
- Free
- Open Source
Application type
Platforms
- Mac
- Windows
- Linux
- Online
- Android
- iPhone
- iPad


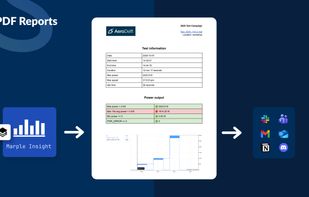
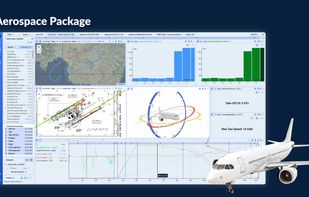
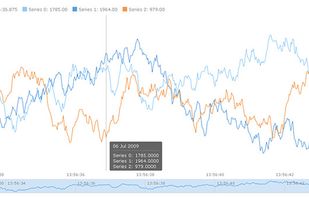
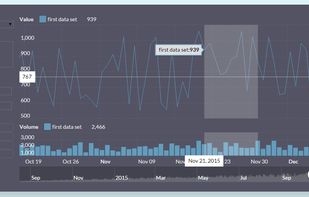
Marple Insight offers powerful tools for interactive analysis of high-frequency time-series data. Engineers and scientists from automotive, aerospace and manufacturing use it to explore, visualise, and analyse sensor or test data.
Cost / License
- Paid
- Proprietary
Platforms
- Online
- Software as a Service (SaaS)
- Self-Hosted
 +2
+2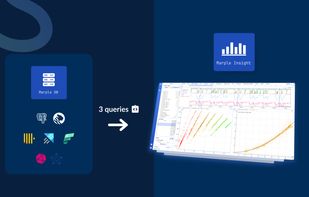

 50 Chart alternatives
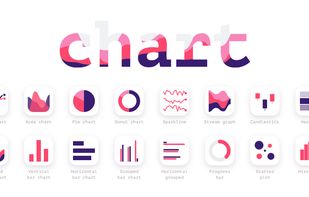
Chart is a plugin for Sketch, Figma, and Adobe XD. Try Chart to save yourself hours of manual, tedious work, and create a graph with real or random data in seconds. It's easy to make, edit, and customize different types of graphs.
Cost / License
- Free
- Open Source (MIT)
Platforms
- Figma
- Sketch
- Adobe XD


Bokeh is a Python interactive visualization library that targets modern web browsers for presentation. Its goal is to provide elegant, concise construction of novel graphics in the style of D3.js, but also deliver this capability with high-performance interactivity over very...
Cost / License
- Free
- Open Source
Platforms
- Mac
- Windows
- Linux
- Online

 79 AnyChart alternatives
Flexible, cross-platform and cross-browser JavaScript (HTML5) charting library that allows you to create interactive bar, pie, line, spline, area, Gantt, stock and other charts, maps and dashboards, with real-time updates and multi-level drill-downs.
Cost / License
- Paid
- Proprietary
Platforms
- Mac
- Windows
- Linux
- Online
- Android
- iPhone
- Self-Hosted
 +2
+2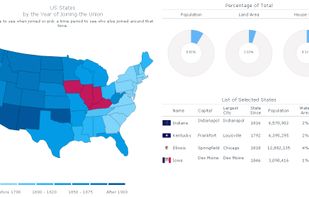

 C
C 58 Vis.js alternatives
vis.js is a dynamic, browser based visualization library. The library is designed to be easy to use, to handle large amounts of dynamic data, and to enable manipulation of and interaction with the data.
Cost / License
- Free
- Open Source
Platforms
- Self-Hosted

 60 amCharts alternatives
amCharts is an advanced charting library that will suit any data visualization need. Our charting solution include Column, Bar, Line, Area, Step, Step without risers, Smoothed line, Candlestick, OHLC, Pie/Donut, Radar/ Polar, XY/Scatter/Bubble, Bullet, Funnel/Pyramid charts as...
Cost / License
- Freemium
- Proprietary
Platforms
- Online
- Self-Hosted


A collection of Flash applets that you embed in your web page, and which fetch data from the web server to display.
Cost / License
- Free
- Open Source
Platforms
- Mac
- Windows
- Linux


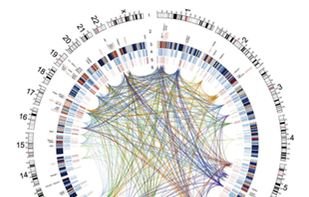
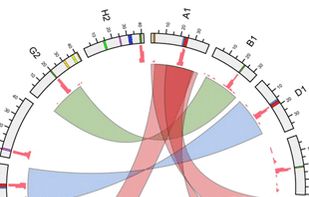
Circos is a software package for visualizing data and information. It visualizes data in a circular layout — this makes Circos ideal for exploring relationships between objects or positions. There are other reasons why a circular layout is advantageous, not the least being the...
 +9
+9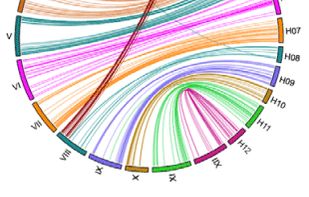


ChartBlocks is an online software platform that lets you quickly and easily build embeddable, shareable charts.