A general purpose real-time charting library for building beautiful, smooth, and high performance visualizations.
D3.js Alternatives
D3.js is described as 'JavaScript library for manipulating documents based on data. D3 helps you bring data to life using HTML, SVG, and CSS' and is a popular charting library tool in the development category. There are more than 50 alternatives to D3.js for a variety of platforms, including Web-based, Windows, Linux, Self-Hosted and Mac apps. The best D3.js alternative is Graphviz, which is both free and Open Source. Other great apps like D3.js are RAWGraphs, Plotly, Chart.js and Processing.js.
Alternatives list


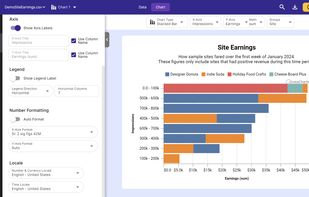
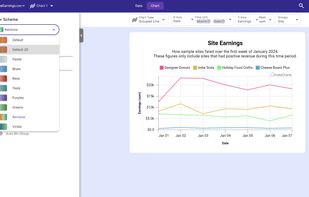
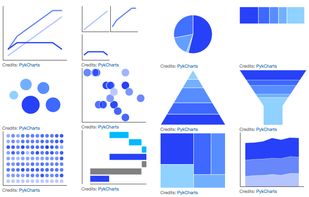
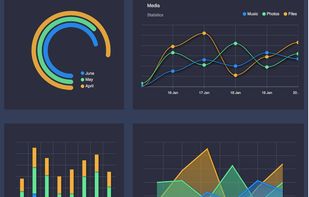
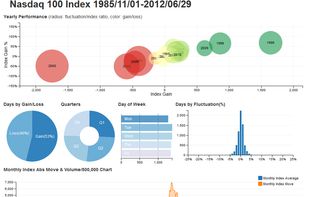
26+ well-designed, themeable, responsive, modular, real-time and easy to use charts and 109+ maps.
Cost / License
- Free
- Open Source
Application type
Platforms
- Mac
- Windows
- Linux
- Online
- Android
- iPhone
- iPad


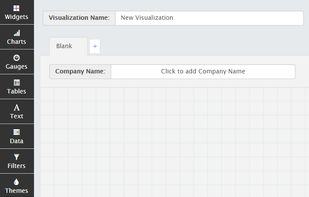
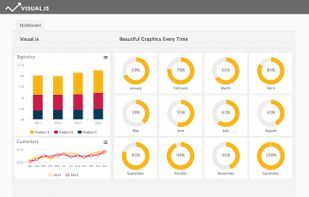
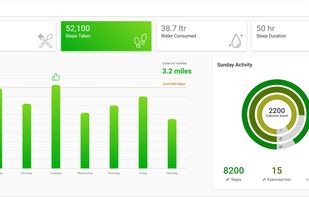
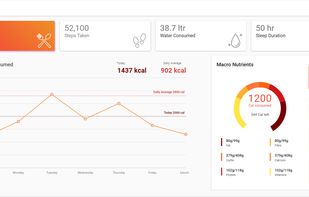
Visual.is was founded on the belief that by maximizing the visual impact of your data, you can transform your business. We are experienced designers and programmers who believe in the value of beautiful information design.
Cost / License
- Freemium
- Proprietary
Platforms
- Online

 57 Essential JS 2 for JavaScript by Syncfusion alternatives
The Syncfusion JavaScript UI controls library is the only suite that you will ever need to build an application since it contains over 60 high-performance, lightweight, modular, and responsive UI components in a single package.
Cost / License
- Paid
- Proprietary
Platforms
- Mac
- Windows
- Linux
 +2
+2


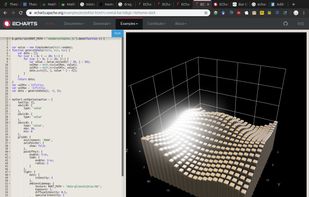
ECharts is an open-sourced JavaScript visualization tool, which can run fluently on PC and mobile devices. It is compatible with most modern Web Browsers, e.g., IE8/9/10/11, Chrome, Firefox, Safari and so on.
Cost / License
- Free
- Open Source (Apache-2.0)
Platforms
- Online


ApexCharts.js - An open-source HTML5 JavaScript charting library that helps developers to create responsive & interactive JS charts for web pages.
Cost / License
- Free
- Open Source
Platforms
- Online


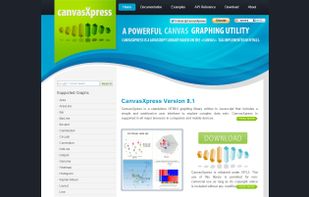
CanvasXpress is a standalone HTML5 graphing library written in Javascript that includes a simple and unobtrusive user interfase to explore complex data sets.


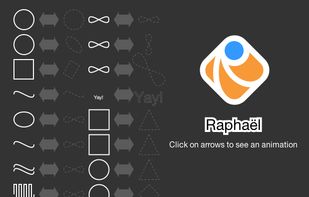
Raphaël is a small JavaScript library that should simplify your work with vector graphics on the web. If you want to create your own specific chart or image crop and rotate widget, for example, you can achieve it simply and easily with this library.
Cost / License
- Free
- Open Source
Platforms
- Online
 +2
+2


dc.js is a JavaScript charting library with native Crossfilter support and allowing highly efficient exploration on large multi-dimensional dataset (inspired by Crossfilter 's demo). It leverages d3 engine to render charts in CSS friendly SVG format. Charts rendered using dc.


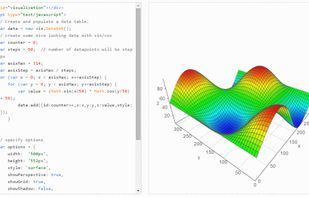
vis.js is a dynamic, browser based visualization library. The library is designed to be easy to use, to handle large amounts of dynamic data, and to enable manipulation of and interaction with the data.
Cost / License
- Free
- Open Source
Platforms
- Self-Hosted


InstaCharts is an online chart maker that will make charts from spreadsheet files including excel, csv, json and jsonl. Quickly unlock insights in your spreadsheets by letting InstaCharts do the heavy lifting. Find something interesting?
Cost / License
- Freemium
- Proprietary
Application type
Platforms
- Online
- Software as a Service (SaaS)