Cost / License
- Free Personal
- Proprietary
Platforms
- Mac
- Windows
- Linux
- Online


Apps similar to ChartURL include RAWGraphs, which is free and open source. Other options are D3.js, Tableau, Plotly and Google Charts. Charting Library Tools like ChartURL are a crowded field, with more than 50 alternatives for the web, self-hosting, Windows, Mac and Linux.

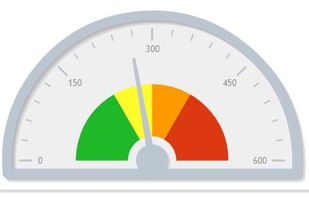
Database driven Charts & Gauges for PHP — HTML5 Visualizations for Web & Mobile. Line Charts, Multi-line Area Charts, Bar Charts, Pie/Donut Charts, Meter Guages, Funnel Charts and many more. Responsive, Interactive, Animated, Easy-to-Use!
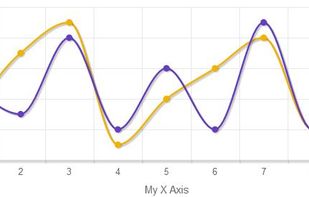
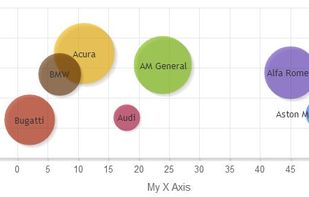


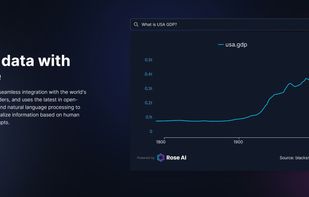
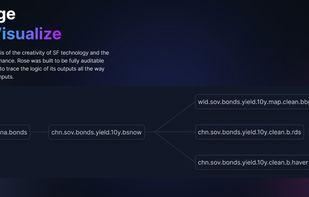
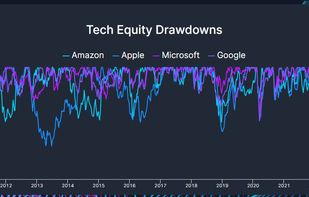
Rose is a cloud data platform designed to help users find, engage, visualize and share data. It enables integration of external and internal data, with the ability to permission data for internal teams or third parties.


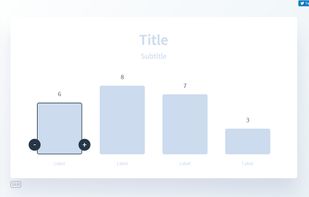
Chartico helps you to create bar charts super-fast. Just click to create a new chart, add/remove bars and adjust the levels as needed.
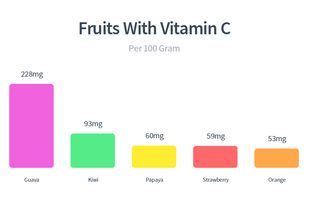


Progress Software (NASDAQ: PRGS) is a global provider of leading application infrastructure software to develop, deploy, integrate and manage business applications.





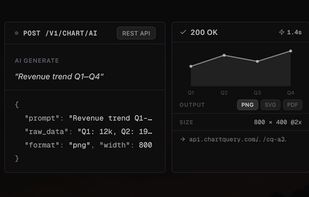
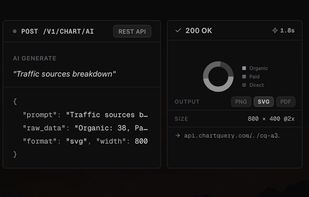
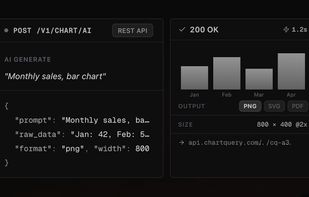
REST API platform for on-demand generation of charts, diagrams in formats like bar, line, pie, radar, scatter, Mermaid, PlantUML, GraphViz, D2, as well as QR codes, barcodes, and labels for technical or business applications, with integration via HTTP or playground.
 France
 EU
EU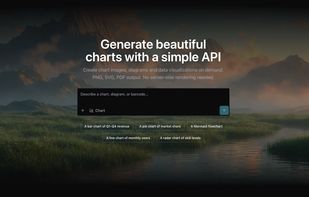


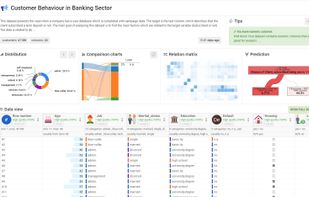
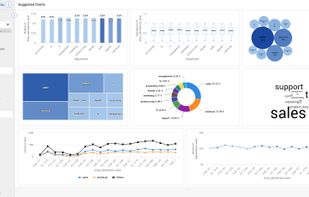
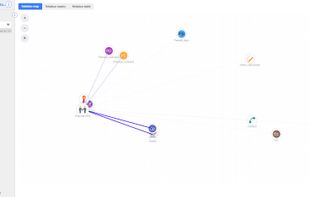
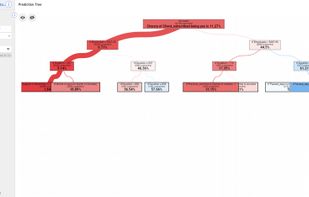
An amazing and fast data exploration tool with many unique features like prediction tree, automatic charts, relation map and report (canvas).


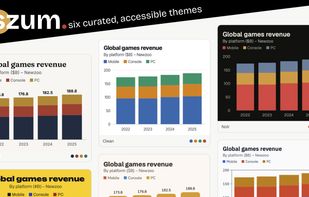
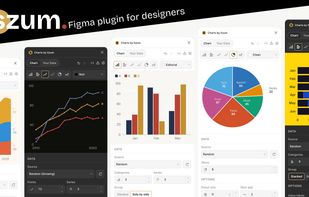
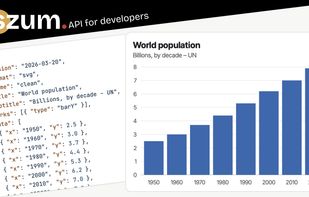
Szum is a chart creation platform for producing publication-ready data visualizations across websites, static images, email, Figma and AI tools.
 Switzerland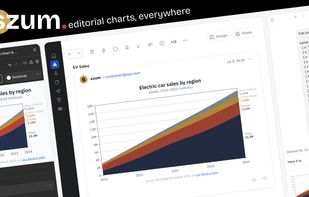


Aimbly is the perfect solution for busy professionals who need quick and accurate generate insights for your data, and create summaries for their meetings, without compromising security and privacy.
 United States


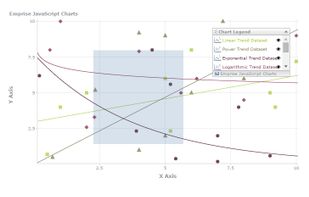
With genuine ease of use and complete customization Emprise JavaScript Charts provides you with the tools you need to publish your data quickly and in a variety of formats. With its wide range of interactive features, simple and straightforward implementation, and unparalleled...