CanvasJS Charts Alternatives
CanvasJS Charts is described as 'CanvasJS is an easy to use HTML5 and Javascript Charting library. It runs across devices including iPhone, iPad, Android, Windows Phone, Microsoft Surface, Desktops, etc. This allows you to create rich dashboards that work on all the devices without compromising on' and is a charting library tool in the development category. There are more than 50 alternatives to CanvasJS Charts, not only websites but also apps for a variety of platforms, including Self-Hosted, Mac, Windows and Linux apps. The best CanvasJS Charts alternative is D3.js, which is both free and Open Source. Other great sites and apps similar to CanvasJS Charts are Chart.js, RAWGraphs, Plotly and Highcharts.
Alternatives list

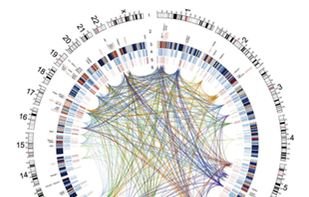
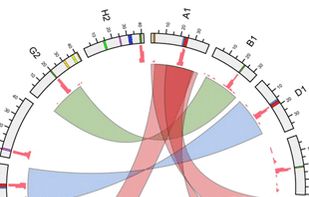
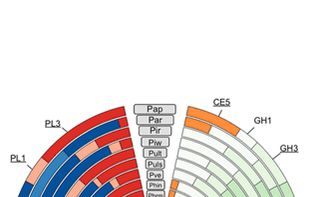
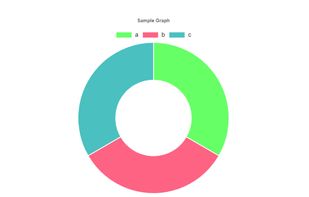
Circos is a software package for visualizing data and information. It visualizes data in a circular layout — this makes Circos ideal for exploring relationships between objects or positions. There are other reasons why a circular layout is advantageous, not the least being the...
 +9
+9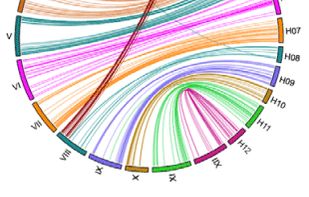


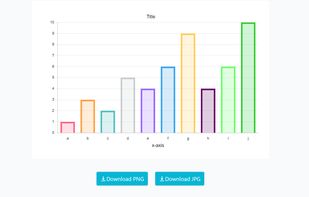
Chose the chart type, copy&paste the data to spreadsheet and design your chart.
Cost / License
- Free Personal
- Proprietary
Platforms
- Online
- Software as a Service (SaaS)


Cost / License
- Free Personal
- Proprietary
Platforms
- Mac
- Windows
- Linux
- Online


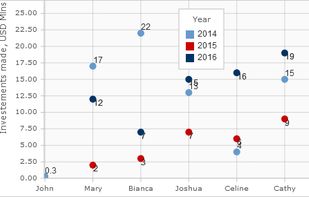
Free JS Chart supports all essential chart types: line, scatter, vertical bar and pie. You can add a title and unlimited number of legends. The library offers customizable grid and unlimited number of chart series. Users can pan and zoom the chart as well rotate pie charts.
Cost / License
- Free
- Proprietary
Platforms
- Online
- Self-Hosted


An Alternative to Google Image Charts that enables developers and marketers to embed personalized charts in their emails, Slackbots, web/mobile apps, and more.
Cost / License
- Freemium
- Proprietary
Platforms
- Online
- Self-Hosted


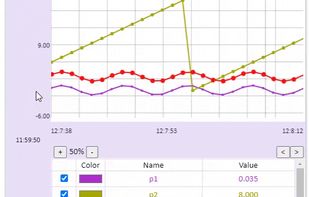
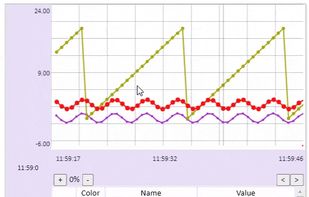
RTCjs (Real Time Chart) is a JavaScript library designed for real time applications including engineering solutions and plotting any other parameters. It's size is small making it fastest to load. It is designed for quickest implementation and consists of functions that are...
Cost / License
- Free
- Open Source (MIT)
Platforms
- Mac
- Windows
- Linux
- Online
- Microsoft Edge
- Google Chrome
- Firefox


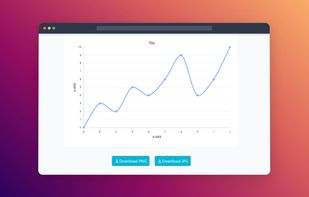
Create a line graph for free with easy to use tools and download the line graph as jpg or png file. Customize line graph according to your choice.
Cost / License
- Free
- Proprietary
Platforms
- Online
 +3
+3

 32 Open Flash Chart alternatives
A collection of Flash applets that you embed in your web page, and which fetch data from the web server to display.
Cost / License
- Free
- Open Source
Platforms
- Mac
- Windows
- Linux


