CanvasJS Charts Alternatives
CanvasJS Charts is described as 'CanvasJS is an easy to use HTML5 and Javascript Charting library. It runs across devices including iPhone, iPad, Android, Windows Phone, Microsoft Surface, Desktops, etc. This allows you to create rich dashboards that work on all the devices without compromising on' and is a charting library tool in the development category. There are more than 50 alternatives to CanvasJS Charts, not only websites but also apps for a variety of platforms, including Self-Hosted, Mac, Windows and Linux apps. The best CanvasJS Charts alternative is D3.js, which is both free and Open Source. Other great sites and apps similar to CanvasJS Charts are Chart.js, RAWGraphs, Plotly and Highcharts.
Alternatives list
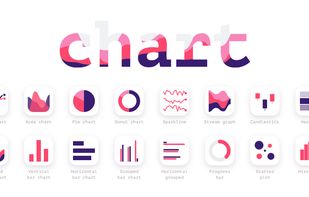
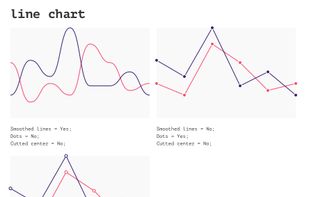
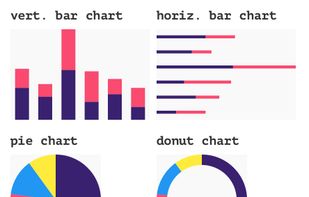
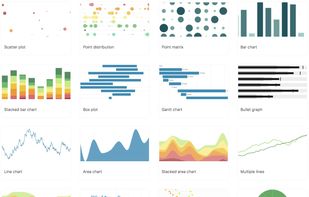
 50 Chart alternatives
Chart is a plugin for Sketch, Figma, and Adobe XD. Try Chart to save yourself hours of manual, tedious work, and create a graph with real or random data in seconds. It's easy to make, edit, and customize different types of graphs.
Cost / License
- Free
- Open Source (MIT)
Platforms
- Figma
- Sketch
- Adobe XD


ArcadiaCharts is a premium JavaScript charting library for the usage in web based environments.
Cost / License
- Free
- Proprietary
Platforms
- Online

 42 Charts 4 PHP alternatives
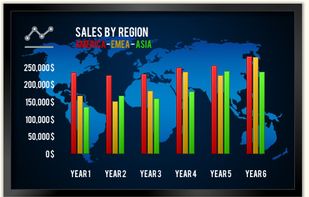
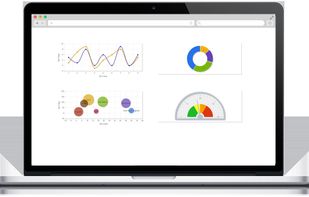
Database driven Charts & Gauges for PHP — HTML5 Visualizations for Web & Mobile. Line Charts, Multi-line Area Charts, Bar Charts, Pie/Donut Charts, Meter Guages, Funnel Charts and many more. Responsive, Interactive, Animated, Easy-to-Use!
Cost / License
- Free Personal
- Proprietary
Platforms
- Online
 +2
+2


RGraph is a HTML5 canvas graph library. It uses features that became available in HTML5 (specifically, the CANVAS tag) to produce a wide variety of graph types: bar chart, bi-polar chart (also known as an age frequency chart), donut chart, funnel chart, gantt chart, horizontal...
Cost / License
- Free Personal
- Proprietary
Platforms
- Mac
- Windows
- Linux


Turn boring data into a visual masterpiece using picasso.js, an open-source library from Qlik.
 +1
+1


Cost / License
- Free
- Open Source
Platforms
- Self-Hosted


We enhance free or commercial third-party chart products with new features and emulated charts. We feature thousands of almost ready-to-use charts with Google Charts, jqPlot, Highcharts, AnyChart, FusionCharts, amCharts, CanvasJS, Syncfusion, Shield UI, and the Microsoft ASP.
Cost / License
- Paid
- Proprietary
Platforms
- Online
 +5
+5


Aimbly is the perfect solution for busy professionals who need quick and accurate generate insights for your data, and create summaries for their meetings, without compromising security and privacy.
Cost / License
- Freemium
- Proprietary
Platforms
- Software as a Service (SaaS)


pChart is a PHP class oriented framework designed to create anti-aliased charts. While creating this library, we focused on two key axis : quality and speed.
Cost / License
- Free Personal
- Open Source
Application type
Alerts
- Discontinued
Platforms
- Mac
- Windows
- Linux
- Online
- Self-Hosted
 +1
+1


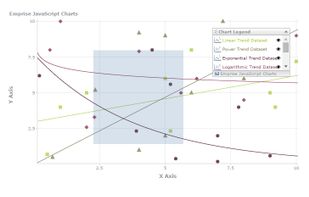
With genuine ease of use and complete customization Emprise JavaScript Charts provides you with the tools you need to publish your data quickly and in a variety of formats. With its wide range of interactive features, simple and straightforward implementation, and unparalleled...
Cost / License
- Freemium
- Proprietary
Platforms
- Online