


Bouquet automatically generates REST API endpoints for front-end developers to focus on UX and visualizations with HighCharts, D3.js and others.
Platforms
- Mac
- Windows
- Linux
- Self-Hosted
 United States
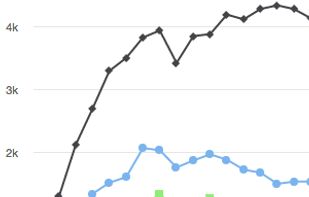

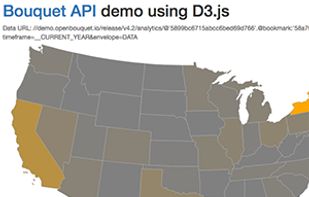

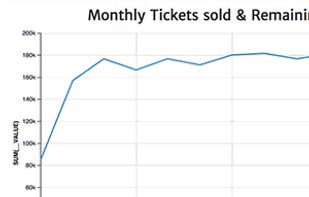

+5
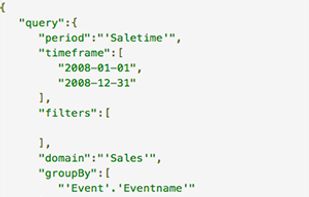


Apps similar to bipp Analytics include RAWGraphs, which is free and open source. Other options are Tableau, Microsoft Power BI, Retool and Plotly. There's no shortage of Business Intelligence Tools like bipp Analytics, with more than 100 alternatives for the web, Windows, Mac, self-hosting and iPhone.
Bouquet automatically generates REST API endpoints for front-end developers to focus on UX and visualizations with HighCharts, D3.js and others.
United States
Sisense is a business intelligence and data analytics software that lets non-techies join, analyze, and visualize multiple large data sets in interactive dashboards.
United States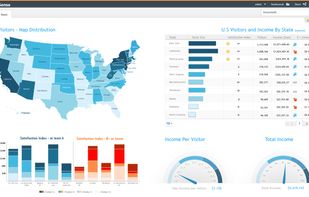


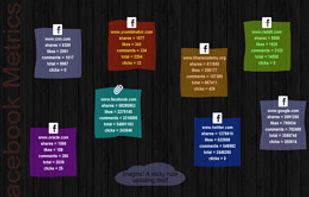
InfoCaptor Enterprise provides free online dashboard to track your social metrics and hook up to any of your database.
United States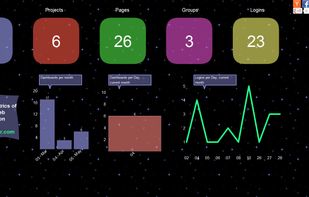
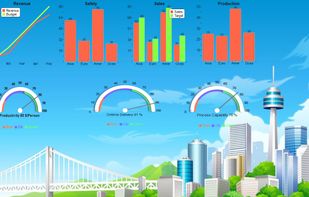


Viur allows you to do business analytics on top of your operational databases (also CRM, ERP databases), cloud services and files. It's a Business Intelligence tool that anyone can use.
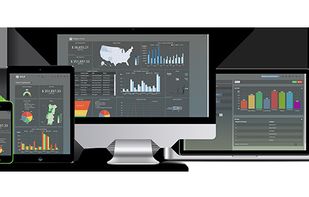


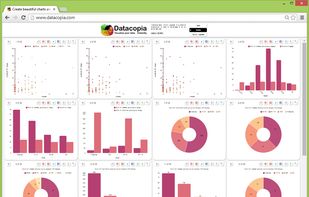
Datacopia brings you a visualization experience that's been designed from the ground up to take the pain out of making charts and graphs, so you spend less time manipulating spreadsheets, and more time understanding your data.
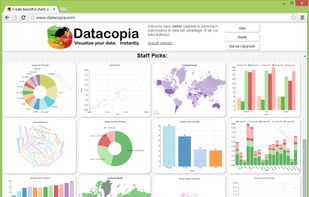


Gain insights and make informed decisions by letting you consolidate, visualize, and share your business's key metrics.
United States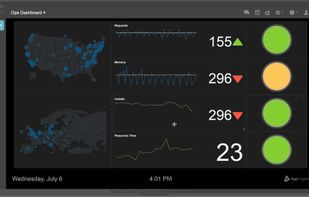


A business intelligence tool that includes ad hoc reporting, self-service data visualization and dashboards, predictive analytics, mobile apps, and more.
 Germany
 EU
EU
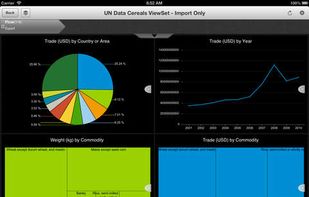



The TIBCO Spotfire Enterprise Analytics platform offers a radically faster business intelligence experience and is far more adaptable to specific industry and business challenges than traditional alternatives.
United States
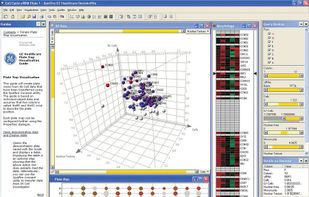


datapine enables people to explore, visualize and share data in one central analytics platform, that offers smart data connectors, a wealth of advanced BI 4.0 features and interactive dashboards.
GermanyEU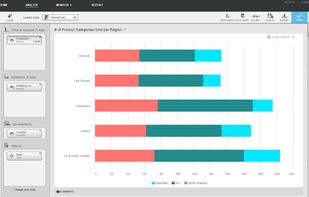


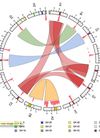
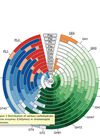
Circos is a software package for visualizing data and information. It visualizes data in a circular layout — this makes Circos ideal for exploring relationships between objects or positions. There are other reasons why a circular layout is advantageous, not the least being the...
 Canada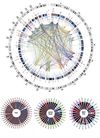


Holistics helps you prepare, query, visualize and share information from your database to access business reports and dashboards online.


Cluvio is the #1 cloud BI platform for startups and data-driven teams, trusted by over 300 companies. Use SQL and R to analyze your data and in few minutes create beautiful, interactive dashboards for your entire company.
GermanyEU


 Singapore


