


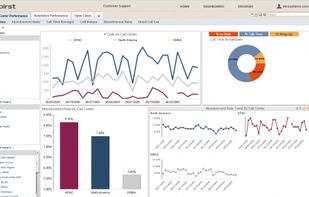
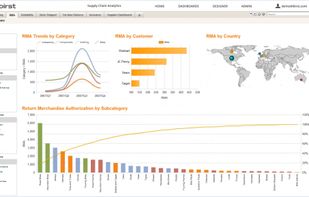
Enterprise-caliber BI delivers accurate, actionable content in an intuitive, self-service environment. It allows users to combine data from different source systems to get answers to their most pressing business concerns in real time.
 United States



Apps similar to Aimbly include D3.js, which is free and open source. Other options are Tableau, RAWGraphs, Plotly and Google Charts. There's no shortage of Charting Library Tools like Aimbly, with more than 25 alternatives for the web, Mac, Windows, self-hosting and Linux.
Enterprise-caliber BI delivers accurate, actionable content in an intuitive, self-service environment. It allows users to combine data from different source systems to get answers to their most pressing business concerns in real time.
United States
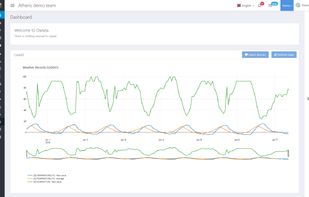
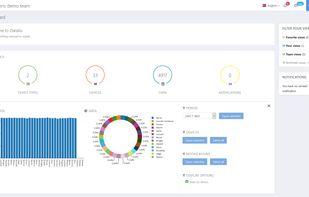
Owlata is a new class of IoT Data Management System (DMS) that works as a global connector for Internet of Things system integration. It automates most of the data processes and connectors, and let you focus on valuable information.
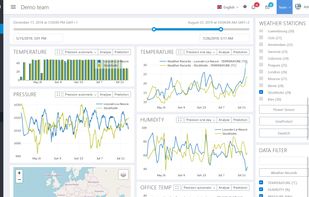


FusionCharts Suite XT helps you create interactive JavaScript charts, gauges and maps in a jiffy for all your web, mobile and enterprise applications. Using it, you can build awesome dashboards, reports, analytics, monitors, surveys that blend aesthetic elegance and actionable...
 United Kingdom
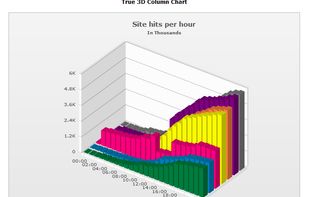
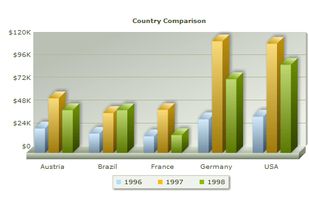


The Syncfusion JavaScript UI controls library is the only suite that you will ever need to build an application since it contains over 60 high-performance, lightweight, modular, and responsive UI components in a single package.
United States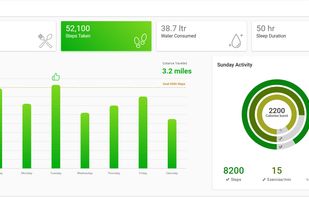
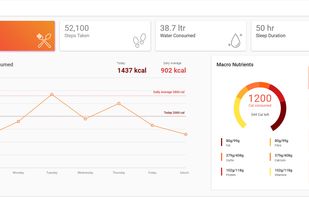
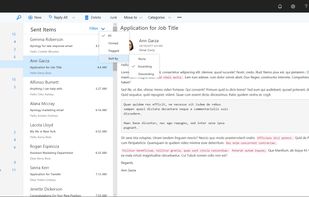
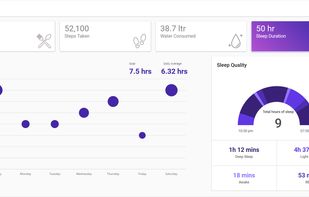


Looker gives you access to your organization’s data. Many users start by browsing through the reports - which we call “Looks” - and dashboards that others in their organization have already created. This page will show you how to get started browsing.
United States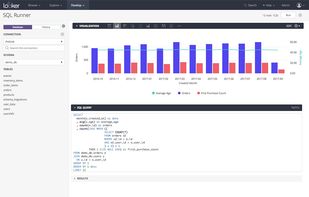


An Alternative to Google Image Charts that enables developers and marketers to embed personalized charts in their emails, Slackbots, web/mobile apps, and more.


Tercept automatically aggregates and organizes all monetization data,analytics data and marketing data into one single dashboard with powerful querying and visualization capabilities. You can setup custom reports and automate 100% of your reporting.
 India
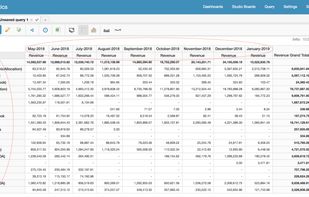

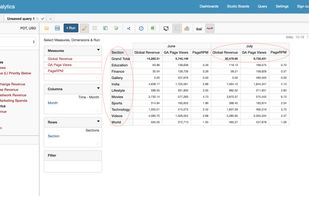
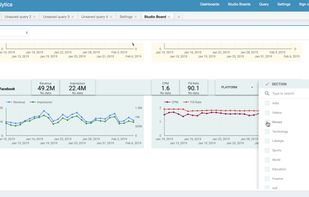


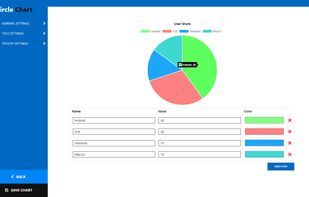
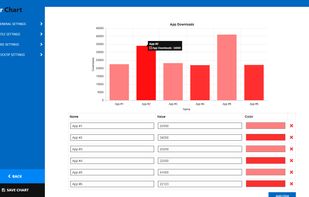
ActiveChart is a free desktop app that lets you very easily create interactive or static charts. Select from 6 chart types from bar to pie charts, configure the settings and export as HTML or a static image.


An online fundraising platform for schools, non-profits and businesses looking to give away NFTs and enable NFT gated experiences.
United States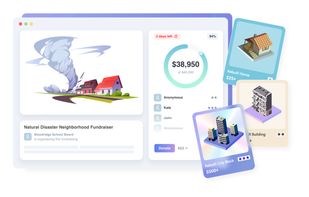


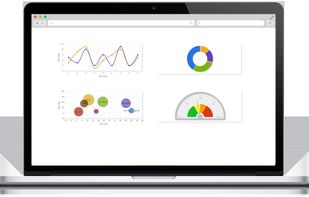
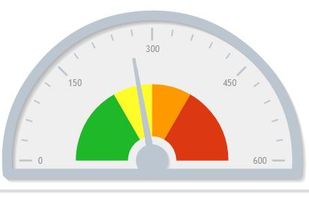
Database driven Charts & Gauges for PHP — HTML5 Visualizations for Web & Mobile. Line Charts, Multi-line Area Charts, Bar Charts, Pie/Donut Charts, Meter Guages, Funnel Charts and many more. Responsive, Interactive, Animated, Easy-to-Use!
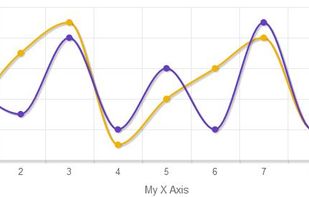
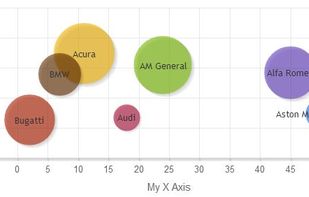


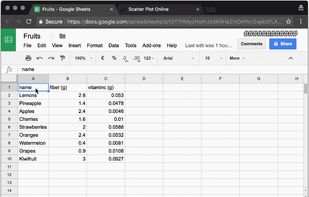
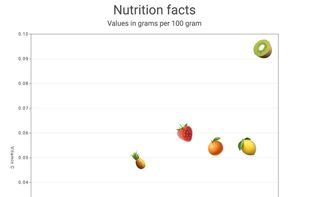
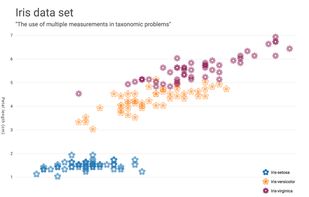
scatterplot.online is a tool for quickly creating scatter plots from data in the browser. No account, no login required. Just drag and drop csv file or copy paste it into the page and you will see your diagram in a matter of seconds.
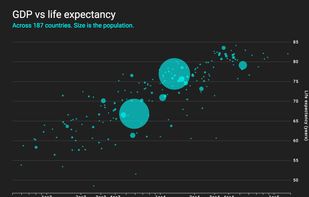


bipp is an enterprise-grade cloud, business intelligence platform. We help data analysts create faster queries & deliver sharper insights.


