• R (programming language) icon
  • R AnalyticFlow icon
  • RKWard icon
  • BlueSky Statistics icon
  • Exploratory icon
  • +8

GUIs to save from typing R code

dimlakgorkehgzdimlakgorkehgz13 appsUpdated
Copy a direct link to this comment to your clipboard

R packages are much easier to explore if finding and writing each function is done for you. GUIs presented here do that. Just fill out a PnC dialogue and they generate R code. This is helpful for beginners, lazy and forgetful experts too. These do EDA, stats and viz but not real ML. Bottom 4 can be automatically run and installed from R script at end of this page. Source: http://qr.ae/TU8D3s

I liked trying out everything on my current fave dataset. I really wish I had explored these options as I was starting out because they would have saved me months of work. R studio notebooks are great too but they are better for depth not breadth.

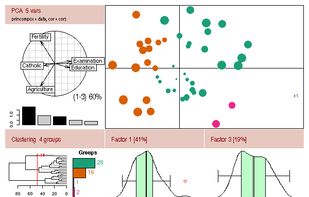
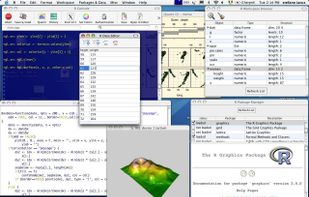
  1. R is a free software environment for statistical computing and graphics. It is a GNU project which is similar to the S language and environment which was developed at Bell Laboratories (formerly AT&T, now Lucent Technologies) by John Chambers and colleagues. R can be consider.

    Cost / License

    • Free
    • Open Source

    Application type

    Platforms

    • Mac
    • Windows
    • Linux
    • BSD
    R (programming language) screenshot 1
    On Unix
    On Mac
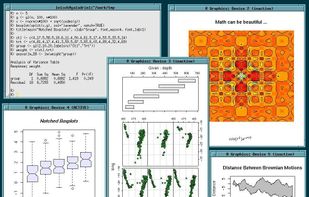
  2. R AnalyticFlow is a data analysis software that utilizes the R environment for statistical computing. In addition to intuitive user interface, it also provides advanced features for R experts.

    Cost / License

    • Free
    • Proprietary

    Platforms

    • Mac
    • Windows
    • Linux
    R AnalyticFlow screenshot 1
    R AnalyticFlow screenshot 1
    dimlakgorkehgzdimlakgorkehgz’s note

    Custom point-and-click dialogues even if few come with package. 2d graphical workflow helps organize and explain. Most recommended on Quora after Rstudio.

  3. RKWard icon
     Like

    RKWard is an easy to use, transparent frontend to the R programming language, a very powerful, yet hard-to-get-into scripting-language with a strong focus on statistic functions. RKWard tries to combine the power of the R-language with the ease of use of commercial statistical...

    Cost / License

    • Free
    • Open Source

    Application type

    Platforms

    • Mac
    • Windows
    • Linux
    RKWard screenshot 1
    RKWard screenshot 1
    dimlakgorkehgzdimlakgorkehgz’s note

    Full IDE like Rstudio. It has very good dialogues for things like package installer and graphics device. Has more common viz analysis pnc gui.

  4. BlueSky Statistics is a fully featured statistics application and development framework built on the open source R project.

    Cost / License

    • Freemium
    • Open Source

    Application type

    Platforms

    • Windows
    BlueSky Statistics screenshot 1
    dimlakgorkehgzdimlakgorkehgz’s note

    Nicest interface and Unique varieble manipulation GUI, but rattle seems more effective anyway. Might be great for complete beginners. 3D scatterplot. Not all functions in free trial.

  5. Interactive Exploratory Data Analysis for Everyone Build your reproducible data analysis with simple command line interface and visualization on desktop.

    Cost / License

    • Freemium
    • Proprietary

    Platforms

    • Online
    Exploratory screenshot 1
    dimlakgorkehgzdimlakgorkehgz’s note

    Analysis and viz don't seem to export R code. 40$/m 30d trial. lots of built in scrape scripts. good fast interface. common functions rather than unique. crashes

  6. Displayr icon
     Like

    Displayr is online data science and data analytics software. It was created so smart people could do their own data science: explore, model, visualize and report. One app for everything. Easy for novices, powerful for experts.

    Cost / License

    • Paid
    • Proprietary

    Application type

    Platforms

    • Online
    Displayr screenshot 1
    Displayr screenshot 1
    Displayr screenshot 2
    +3
    Displayr screenshot 3
    dimlakgorkehgzdimlakgorkehgz’s note

    GUI PnC R code generation but gui is clunky and slow. Online only, only 10 hours free. Bunch of unique and useful graphs though.

  7. Stagraph icon
     Like

    Stagraph is new professional tool for visual data exploration and statistical graphics. This tool brings data science features and functions of R language to user without the need of coding. Your workflow in software is as follows:

    Cost / License

    • Freemium
    • Proprietary

    Platforms

    • Windows
    Stagraph screenshot 1
    Stagraph screenshot 1
    Stagraph screenshot 2
    +13
    Stagraph screenshot 3
    dimlakgorkehgzdimlakgorkehgz’s note

    Maybe great ggploter but does not output R code unless paid and crashes, though in development.

Run from and on top of R

  1. Rattle icon
     Like

    Rattle is a GUI for data mining using R. All interactions through the graphical user interface are captured as R script. It presents statistical and visual summaries of data, transforms data, builds machine learning models, and scores new datasets.

    Cost / License

    • Free
    • Open Source

    Platforms

    • Mac
    • Windows
    • Linux
    https://rattle.togaware.com/rattle-main-audit.png
    Rattle screenshot 1
    Rattle screenshot 2
    +1
    Rattle screenshot 3
    dimlakgorkehgzdimlakgorkehgz’s note

    Imho, best tools for common data analysis workflow.

  2. Deducer icon
     Like

    Deducer is designed to be a free easy to use alternative to proprietary data analysis software such as SPSS, JMP, and Minitab. It has a menu system to do common data manipulation and analysis tasks, and an excel-like spreadsheet in which to view and edit data frames.

    Cost / License

    • Free
    • Open Source

    Application type

    Platforms

    • Mac
    • Windows
    • Linux
    • Xfce
    Deducer screenshot 1
    Deducer screenshot 1
    Deducer screenshot 2
    dimlakgorkehgzdimlakgorkehgz’s note

    Deducer is similar to rattle but Java based. May be best GGploter with lots of customizable plotting templates.

  3. A basic-statistics GUI for the R (programming language) icon R (programming language), based on the tcltk toolkit

    Cost / License

    • Free
    • Proprietary

    Platforms

    • Mac
    • Windows
    • Linux
    • Xfce
    The R Commander screenshot 1
    dimlakgorkehgzdimlakgorkehgz’s note

    Of all R GUIs RC's plugins best for exploring esoteric packages and learning stats. Updated enough to write R markdown code.

  4. The ML Studio is interactive for EDA, statistical modeling and machine learning applications. Based on Shiny, with Plotly interactive data visualization, DT HTML tables and H2O machine learning and deep. data science pipeline workflow.

    Cost / License

    • Free
    • Open Source

    Platforms

    • Mac
    • Windows
    • Linux
    • Self-Hosted
    • R (programming language)
    dimlakgorkehgzdimlakgorkehgz’s note

    Lots planned.

  5. esquisse icon
     Like

    RStudio add-in to make plots with ggplot2. Contribute to dreamRs/esquisse development by creating an account on GitHub. Exports R code.

    Cost / License

    • Free
    • Open Source

    Platforms

    • Mac
    • Windows
    • Linux
    hi
    dimlakgorkehgzdimlakgorkehgz’s note

    Its lots like ggraptr. Easy ggplotting.

  6. ggraptR icon
     Like

    ggraptR is an open source R package providing a GUI for visualization. It is based on principles of visualization analysis by Tamara Munzner, and also acts as a wrapper for functionality implemented in the grammar of graphics for R, ggplot2.

    Cost / License

    • Free
    • Open Source

    Application type

    Platforms

    • Windows
    • Linux
    • Online
    • Self-Hosted
    ggraptR screenshot 1
    ggraptR screenshot 1
    dimlakgorkehgzdimlakgorkehgz’s note

    GGploter GUI. ggraptR uses datasets loaded into R

new.packages <- c("Rcmdr","RcmdrMisc","car","rattle","acepack","htmlTable","cellranger","ggraptR","ggquickeda","esquisse",""ggplotAssist,"ggThemeAssist","JGR","Deducer","DeducerExtras","swirl") new.packages <- new.packages[!(new.packages %in% installed.packages()[,"Package"])] if(length(new.packages)) install.packages(new.packages, dependencies = c("Depends", "Imports", "LinkingTo", "Suggests"))

library(Rcmdr)

#Obtain names of all packages on CRAN names.available.packages <- rownames(available.packages()) #Extract packages names that contain Rcmdr Rcmdr.related.packages <- names.available.packages[grep("Rcmdr", names.available.packages)] Rcmdr.related.packages #Install these packages new.packages <- Rcmdr.related.packages[!(Rcmdr.related.packages %in% installed.packages()[,"Package"])] if(length(new.packages)) install.packages(new.packages, dependencies = c("Depends", "Imports", "LinkingTo", "Suggests"))

library(rattle) rattle()

library(JGR) JGR()

library(ggraptR) ggraptR::ggraptR()

library(ggplot2) p <- ggplot(mtcars, aes(x = hp, y = wt))# + geom_point() + geom_smooth() names(p2) # will show you which objects are available. plot(p2) # shows the updated plot (it is available in the first element of p2)

library("swirl");swirl() #install.packages("sos"); library(sos); findFn("plotPairs"); vignette("sos")

MLstudio

#install.packages("devtools") devtools::install_github("RamiKrispin/MLstudio") #Launch the MLstudio runML()

Comments

dimlakgorkehgz
2

http://stagraph.com/Post?Id=31&Title=Powered+By+R R GUIs section. Need to look into JASP, R RED, and Radiant.

1 reply
saurabhgayali
Replying to @dimlakgorkehgz

I wish Red R had been alive. It was best flow based programming for R just like orange canvas.though I have installers but discontinuation causes it bad for mention.

dimlakgorkehgz
2
GUIs to save from typing R code | AlternativeTo