Apps tagged with 'Memory Profiler'

All apps in Apps tagged with 'Memory Profiler' category. Use the filters below to narrow down your search. 
Copy a direct link to this comment to your clipboard
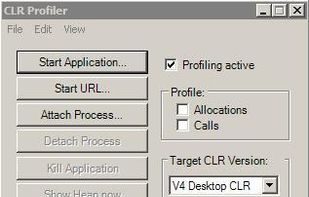
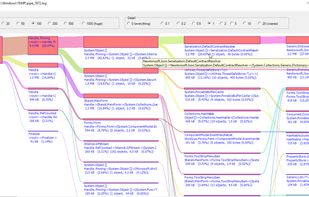
  1. The CLR Profiler allows developers to see the allocation profile of their managed applications. The CLR Profiler includes a number of very useful views of the allocation profile, including a histogram of allocated types, allocation and call graphs, a time line showing GCs of...

    Cost / License

    • Free
    • Open Source

    Since

    • Since 2012

    Platforms

    • Windows
    • US flagUnited States
    CLR Profiler for .NET Framework screenshot 1
    CLR Profiler for .NET Framework screenshot 2
    6 alternatives
  2. ANTS Memory Profiler is a .NET memory profiler for finding memory leaks and optimizing the memory usage of .NET applications written in C# or VB.NET.

    Cost / License

    • Paid
    • Proprietary

    Since

    • Since 2010

    Platforms

    • Windows
    • GB flagUnited Kingdom
    Find out what's holding your objects in memory, with the Object Retention Graph
  3. JustTrace is Telerik’s 2-in-1 memory and performance profiler for .NET. JustTrace profiles .NET apps to pinpoint and assist in resolving memory leaks and performance problems which may damage application quality.

    Cost / License

    • Paid
    • Proprietary

    Since

    • Since 2013

    Alerts

    • Discontinued

    Platforms

    • Windows
    • US flagUnited States
    JustTrace Start Screen
    JustTrace Visual Studio Color Support
    10 alternatives
  4. With dotTrace Memory, you can quickly profile the memory usage of your applications based on .NET Framework up to version 4. The profiling process is not only simple but fast. A wealth of profiling data is accurately recorded and presented in the form of memory snapshots...

    Cost / License

    • Paid
    • Proprietary

    Since

    • Since 2011

    Platforms

    • Windows