CLR Profiler for .NET Framework Alternatives

CLR Profiler for .NET Framework is described as 'The CLR Profiler allows developers to see the allocation profile of their managed applications. The CLR Profiler includes a number of very useful views of the allocation profile, including a histogram of allocated types, allocation and call graphs, a time line showing GCs of' and is an app in the development category. There are five alternatives to CLR Profiler for .NET Framework for Windows and .NET Framework. The best CLR Profiler for .NET Framework alternative is PerfView, which is both free and Open Source. Other great apps like CLR Profiler for .NET Framework are .NET Memory Profiler, ANTS Memory Profiler, dotTrace Memory and dotMemory.

  • FreeOpen Source
  • ...

The CLR Profiler allows developers to see the allocation profile of their managed applications. The CLR Profiler includes a...

More about CLR Profiler for .NET Framework
CLR Profiler for .NET Framework alternatives page was last updated Nov 3, 2020
Copy a direct link to this comment to your clipboard
  1.  4 likes
    Copy a direct link to this comment to your clipboard

    PerfView is a free performance-analysis tool that helps isolate CPU and memory-related performance issues. It is a Windows tool, but it also has some support for analyzing data collected on Linux machines.

    License model

    • FreeOpen Source

    Platforms

    • Windows
    • .NET Framework

    PerfView Features

    1.  System analysis

    PerfView VS CLR Profiler for .NET Framework

     
    • PerfView is the most popular Windows alternative to CLR Profiler for .NET Framework.

    • PerfView is the most popular Open Source & free alternative to CLR Profiler for .NET Framework.

    • PerfView is Free and Open SourceCLR Profiler for .NET Framework is also Free and Open Source
  2. Copy a direct link to this comment to your clipboard

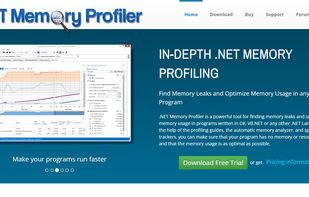
    .NET Memory Profiler is a powerful tool for finding memory leaks and optimizing the memory usage in programs written in C#, VB.NET or any other .NET Language.

    License model

    Country of Origin

    • SE flagSweden
    • European Union flagEU

    Platforms

    • Windows

    .NET Memory Profiler VS CLR Profiler for .NET Framework

     
    • .NET Memory Profiler is the most popular commercial alternative to CLR Profiler for .NET Framework.

    • .NET Memory Profiler is Paid and ProprietaryCLR Profiler for .NET Framework is Free and Open Source
  3. Copy a direct link to this comment to your clipboard

    ANTS Memory Profiler is a .NET memory profiler for finding memory leaks and optimizing the memory usage of .NET applications written in C# or VB.NET.

    License model

    Country of Origin

    • GB flagUnited Kingdom

    Platforms

    • Windows

    ANTS Memory Profiler VS CLR Profiler for .NET Framework

     
  4. Copy a direct link to this comment to your clipboard

    With dotTrace Memory, you can quickly profile the memory usage of your applications based on .NET Framework up to version 4. The profiling process is not only simple but fast. A wealth of profiling data is accurately recorded and presented in the form of memory snapshots...

    License model

    Platforms

    • Windows

    dotTrace Memory Features

    1.  Profiling memory usage

    dotTrace Memory VS CLR Profiler for .NET Framework

     
  5. dotMemory icon
     Like
    Copy a direct link to this comment to your clipboard

    dotMemory allows you to analyze memory usage in a variety of .NET and .NET Core applications: desktop applications, Windows services, ASP.NET web applications, IIS, IIS Express, arbitrary .NET processes, and more.

    7 dotMemory alternatives

    License model

    Country of Origin

    • CZ flagCzechia
    • European Union flagEU

    Platforms

    • Windows

    dotMemory VS CLR Profiler for .NET Framework

     
5 of 5 CLR Profiler for .NET Framework alternatives