Nagios is a powerful monitoring system licensed under Nagios Enterprises that helps organizations identify and resolve IT infrastructure issues.


W
Wavefront by VMware is described as 'Wavefront is an enterprise-class metrics monitoring and real-time analytics service that lets you visualize, query and alert over data from across your stack (infrastructure, containers, network, custom application metrics, business KPIs, etc.)' and is an website in the development category. There are more than 10 alternatives to Wavefront by VMware, not only websites but also apps for a variety of platforms, including Linux, SaaS, Self-Hosted and Windows apps. The best Wavefront by VMware alternative is Nagios, which is both free and Open Source. Other great sites and apps similar to Wavefront by VMware are Datadog, Prometheus, HyperDX and Grafana Loki.
Nagios is a powerful monitoring system licensed under Nagios Enterprises that helps organizations identify and resolve IT infrastructure issues.
Monitor and visualize your IT and DevOps environments seamlessly with over 120 integrations, enabling real-time insight across on-premise and cloud deployments. Utilize robust analytics, graphing, and correlation tools for error logging and network monitoring. Improve collaboration and proactive IT management.


Prometheus is an open-source systems monitoring and alerting toolkit originally built at SoundCloud. Since its inception in 2012, many companies and organizations have adopted Prometheus, and the project has a very active developer and user community.


Grafana Loki is a horizontally-scalable, highly-available, multi-tenant log aggregation system inspired by Prometheus. It is designed to be very cost effective and easy to operate. It does not index the contents of the logs, but rather a set of labels for each log stream.


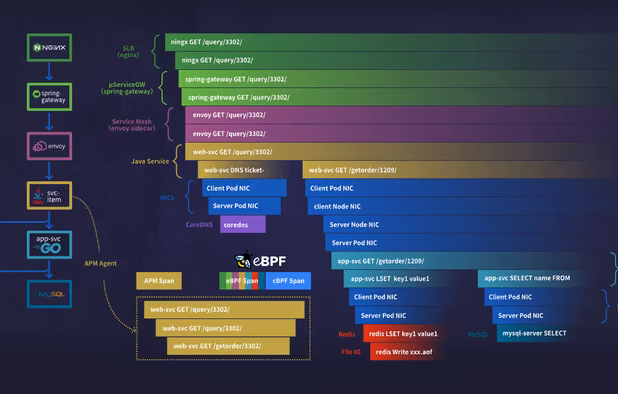
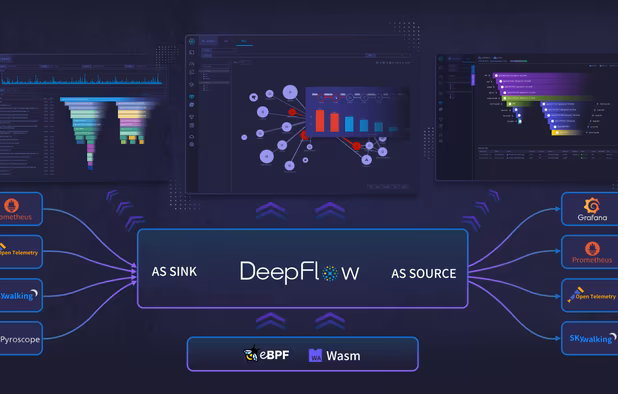
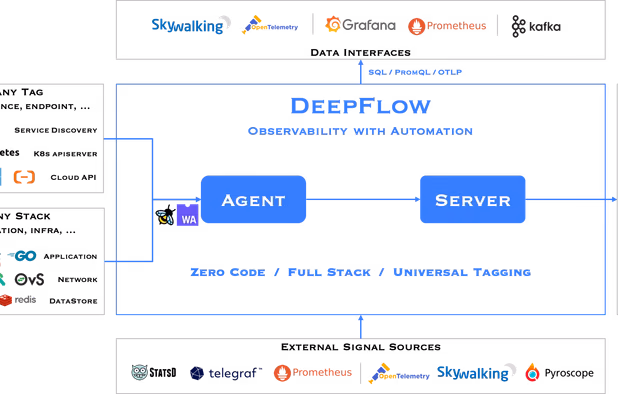
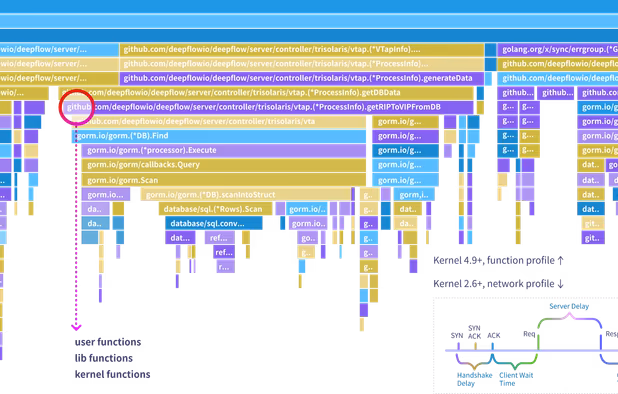
Unify your cloud-native monitoring with zero-code eBPF, advanced profiling, and 10x storage efficiency.
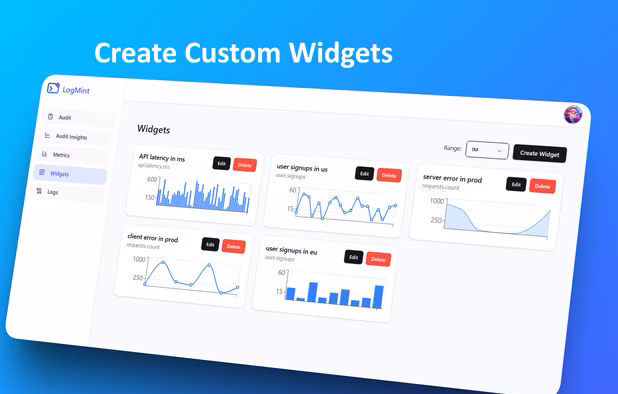
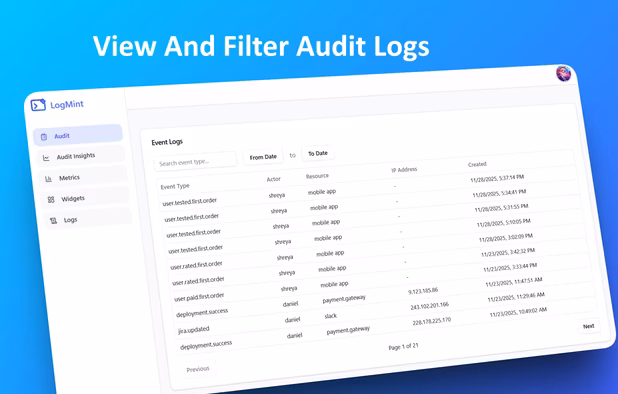
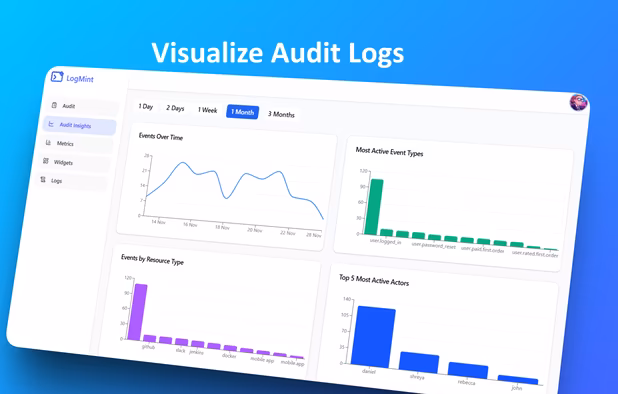
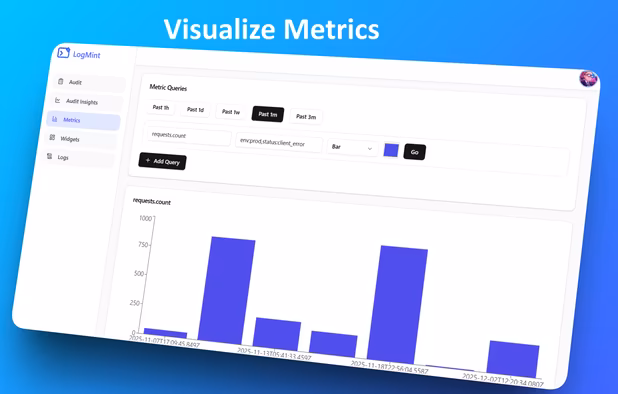
LogMint is a lightweight observability platform for SaaS developers and startups. Track logs, metrics, audit events, dashboards, and alerts all from a single SDK.
Gain unparalleled observability into applications, infrastructure, and network across cloud and hybrid setups. Offers visualizations, distributed tracing, centralized logs, and integrates seamlessly with Azure and third-party services while enhancing security and compliance.


Amazon CloudWatch is a monitoring service for AWS cloud resources and the applications running on AWS. It collect and track metrics, collect and monitor log files, set alarms, and automatically react to changes in AWS resources.

Pinpoint and solve performance issues in your Ruby, Java, .NET, PHP and Python apps with real user, application and server monitoring.

Providing real time diagnostics & insights to the fingertips of hundreds of thousands of developers daily.


Dynatrace combines the industry’s broadest observability and runtime application security with predictive, causal, and generative in a unified platform to deliver answers and intelligent automation from data.


