V
V
Vimspector
1 like
A multi-language debugging system for Vim.
Cost / License
- Free
- Open Source (Apache-2.0)
Platforms
- Vim
- Mac
- Windows
- Linux
- BSD
Features
- Debugging
Vimspector News & Activities
Highlights All activities
Recent News
No news, maybe you know any news worth sharing?
Share a News TipRecent activities
No activities found.
Vimspector information
No comments or reviews, maybe you want to be first?
What is Vimspector?
A multi-language debugging plugin for Vim.
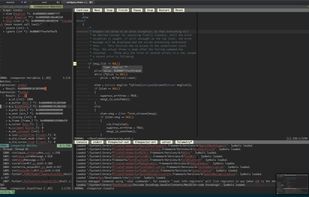
The plugin is a capable Vim graphical debugger for multiple languages. It's mostly tested for C++, Python and TCL, but in theory supports any language that Visual Studio Code supports (but see caveats).
The Vimspector website has an overview of the UI, along with basic instructions for configuration and setup.
Supported debugging features
- flexible configuration syntax that can be checked in to source control
- breakpoints (function, line and exception breakpoints)
- conditional breakpoints (function, line)
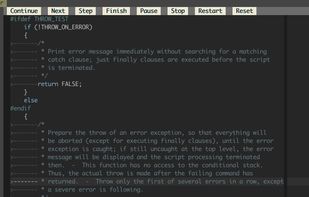
- step in/out/over/up, stop, restart
- run to cursor
- go to line (reset program counter to line)
- launch and attach, including PID picker
- remote launch, remote attach
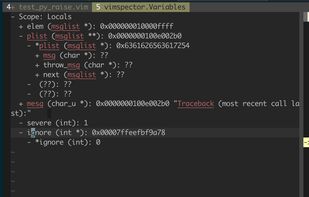
- locals and globals display
- watch expressions with autocompletion
- variable inspection tooltip on hover
- disassembly view and step-by-instruction
- set variable value in locals, watch and hover windows
- call stack display and navigation
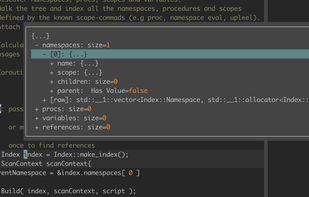
- hierarchical variable value display popup (see <Plug>VimspectorBalloonEval)
- interactive debug console with autocompletion
- launch debuggee within Vim's embedded terminal
- logging/stdout display
- simple stable API for custom tooling (e.g. integrate with language server)
- view hex dump of process memory
- multiple independent debugging sessions (debug different apps in tabs)
- multi-process (multi-session) debugging


