Plotly is the easiest way to graph and share data online. Open-source libraries for JavaScript (comparison with HighCharts at https://plot.ly/highcharts-alternative/), Python, R, and MATLAB.
 United States
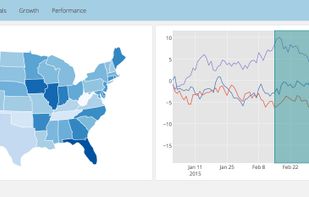

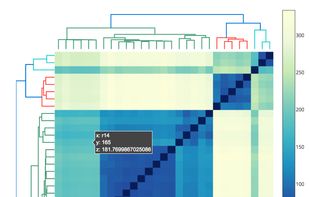

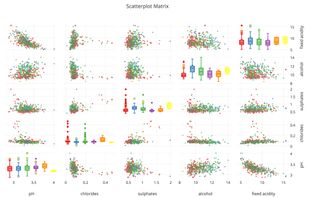


Sites and apps similar to VIDA include Plotly, which is open source with a free version. Other options are Datamatic.io, Datadeck Sheets, ChartBlocks and charte.ca. In total there are six Charting Library Tools like VIDA for iPhone, Chrome OS, self-hosting, Mac and Windows.
Plotly is the easiest way to graph and share data online. Open-source libraries for JavaScript (comparison with HighCharts at https://plot.ly/highcharts-alternative/), Python, R, and MATLAB.
United States
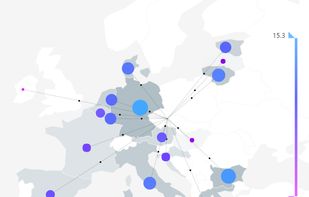
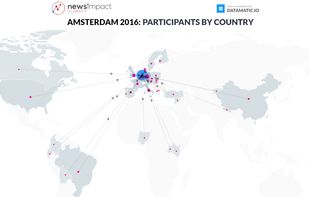
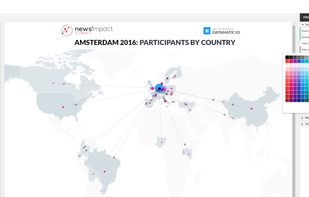
Datamatic is like WordPress for data visualizations, it offers 70+ interactive data visualization templates, Excel-like data editor & beautiful material design styles. Data visualizations can be easily embedded in any website or web application.
 Czechia
 EU
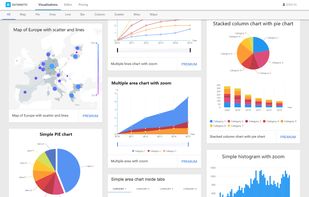


Built by Datadeck, Sheets lets you visualize spreadsheets in just 2 clicks. Automate tedious monthly reports. Turn boring Excel files into eye-popping data visualizations.
United States


ChartBlocks is an online software platform that lets you quickly and easily build embeddable, shareable charts.
 United Kingdom
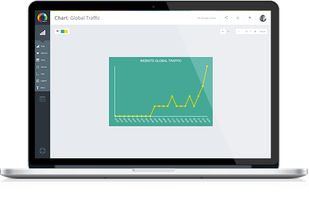


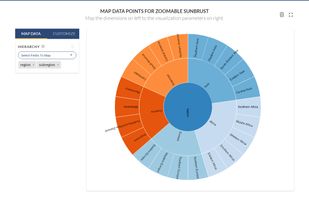
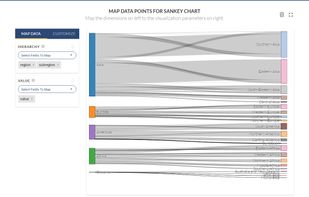
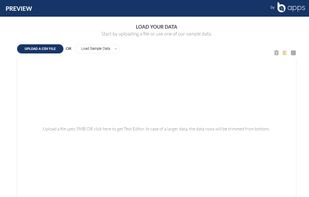
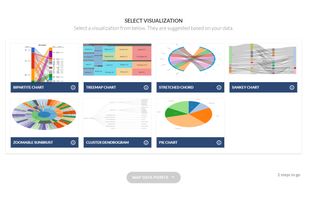
PREVIEW lets you quickly and easily create great looking visualizations of your data, for free, no login required and all through your browser. Simply upload a CSV file or by copy and paste your data in a text box, then select the type of visualization you'd like to create.