Vesana is self-hosted infrastructure monitoring for MSPs and IT teams. It runs on your own Debian or Ubuntu server and is installed with a single command.
Monitored networks need no open ports and no VPN. Agents on Windows and Linux machines, and collectors in remote networks, send their results outbound over HTTPS 443. Devices without an agent are checked over SNMP, SSH, HTTP or their REST API.
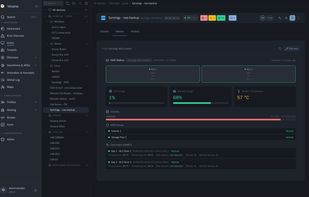
One instance serves many customers: tenants are separated, and roles can be granted per tenant. Ready-made device profiles cover 59 devices, including Synology, QNAP, Proxmox, VMware ESXi, OPNsense, FortiGate, UniFi, MikroTik, Veeam, printers and UPS units. Thresholds and checks can be changed per device without editing code.
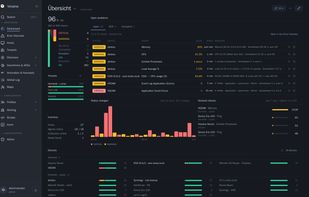
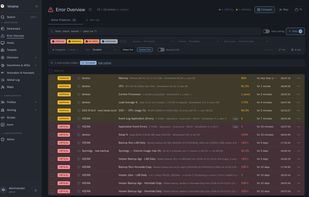
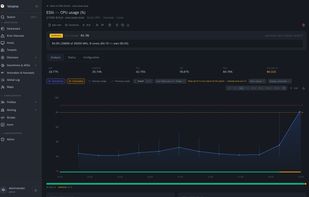
Alerting supports escalation, grouping, downtimes, acknowledgements and dependencies, so a failed switch does not trigger a flood of follow-up alarms. Notifications go to email, Teams, Slack, Telegram, webhooks and push on the phone. Further features: dashboards, anomaly detection and fill-level forecasts, and an MCP server for AI assistants.
All data stays in your own PostgreSQL database. Free for up to 25 hosts; paid plans are priced per host, with unlimited tenants.
Use also on Smartphones with PWA (Web App).
Create an access token to let Claude or any other AI work directly on Vesana, either with read access or full control.






 EU




 Vesana
No comments or reviews, maybe you want to be first?