StockMap icon
StockMap icon

StockMap

 Like

An interactive US stock map sizes company tiles by market value and groups them by sector and industry. An automated model issues two-week relative calls, then publishes hits, misses, base rates and benchmark comparisons, with watchlists, portfolios, alerts and AI stock research.
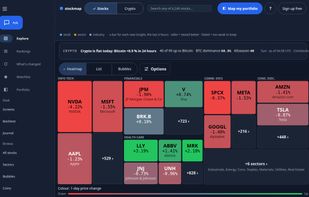
The US stock market as one map, grouped by sector, here coloured by the day's price change.

Cost / License

  • Freemium (Subscription)
  • Proprietary

Since

  • New

Platforms

  • Windows
  • Online
  • Android
  • iPhone
0likes
0articles
Save

Features

Properties

Features

Highlights All activities

StockMap News & Activities

Recent activities

StockMap information

  • Developed by

    US flagYojowa LLC
  • Licensing

    Proprietary and Freemium product.
  • Pricing

    Subscription ranging between $10 and $25 per month + free version with limited functionality.
  • Alternatives

    11 alternatives listed
  • Badge

    Get an embeddable badge for StockMap
  • Supported Languages

    • English

AlternativeTo Category

Business & Commerce

Apple AppStore

  •   Updated 
  •   4.11 avg rating
View in AppStore
StockMap was added to AlternativeTo by Yojowa on and this page was last updated .

No comments or reviews, maybe you want to be first?

Official Links

What is StockMap?

StockMap displays the US stock market as a map where each company is a tile, grouped by sector and industry and sized by market value. It is available in a web browser and on iPhone, Android, and Windows. It also includes a cryptocurrency map for the 100 largest coins, with Bitcoin dominance, the altcoin season index, and CoinGecko price data. The service does not provide cryptocurrency forecasts.

After each US trading day, StockMap assigns covered stocks a directional call for the following two weeks. Calls indicate whether a stock is expected to outperform or underperform IVW, an S&P 500 growth-stock fund; a stock can rise in price while underperforming IVW. Stock pages show current calls and graded history, including missed predictions. Calls are graded after two weeks against the stock's sector median and IVW. The track record includes hit rates, base rates for randomly selected stocks, and recently graded calls; hit rate does not represent the return from following calls.

An AI assistant answers questions about covered stocks using model insights and graded history. The Free plan includes market maps and calls, the track record, one watchlist, a portfolio view, and 40 daily questions. Plus adds model-change alerts, up to 10 watchlists, and portfolio comparisons with the model. Ultimate includes deep-research answers, custom screens, backtesting, and access to model calls through a personal API key.