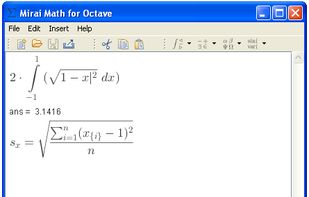
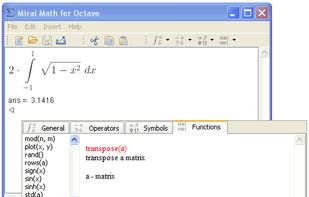
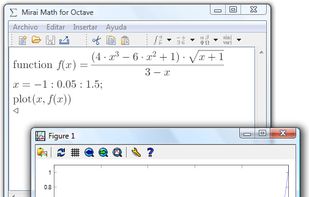
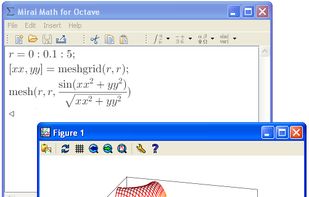
Graphical frontend for GNU Octave. Edit formulas in native mathematical notation. Available / tested for Linux x586 / x86_64, WinXP, Vista, and MacOS.
Cost / License
- Free
- Open Source
Platforms
- Mac
- Windows
- Linux



+3


Sites and apps similar to Statspresso include Qiqqa, which is open source with a free version. Other options are GnuPlot, LabPlot, Plotly and Voyant Tools. Statistical Analyzers like Statspresso are a crowded field, with more than 50 alternatives for Windows, Mac, Linux, iPhone and Android.
Graphical frontend for GNU Octave. Edit formulas in native mathematical notation. Available / tested for Linux x586 / x86_64, WinXP, Vista, and MacOS.

Bokeh is a Python interactive visualization library that targets modern web browsers for presentation. Its goal is to provide elegant, concise construction of novel graphics in the style of D3.js, but also deliver this capability with high-performance interactivity over very...


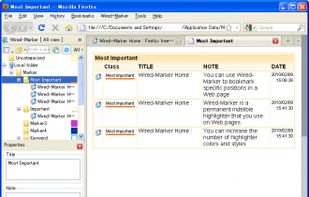
Wired-Marker is a permanent (indelible) highlighter that you use on Web pages. The highlighter, which comes in various colors and styles, is a kind of electronic bookmark that serves as a guide when you revisit a Web page.


Technical graphing and data analysis for Macintosh and Windows. IGOR Pro creates publication quality scientific graphics used by scientists and engineers around the world. IGOR Pro 6 is an extraordinarily powerful and extensible scientific graphing, data analysis, image...


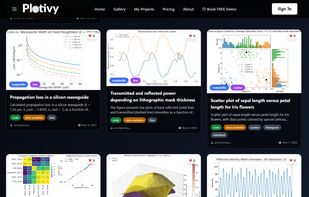
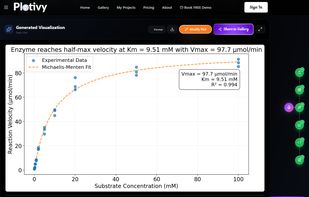
Plotivy is a modern, AI-assisted platform designed specifically for scientific data visualization and image analysis. Built by an experimental physicist for researchers who want to focus on science rather than wrestling with plotting libraries.
 Italy
Italy EU
EU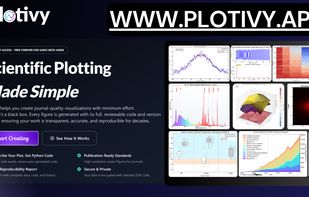



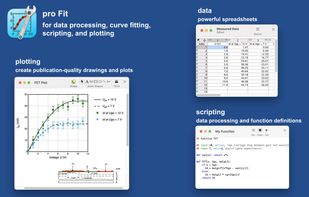
pro Fit, the best curve fitting, regression, plotting, data analysis for macOS. Python and LaTeX support, publication quality plots.


SigmaPlot is a proprietary software package for scientific graphing and data analysis for Microsoft Windows. The software can read multiple formats and perform mathematical transforms and statistical analyses.
 United States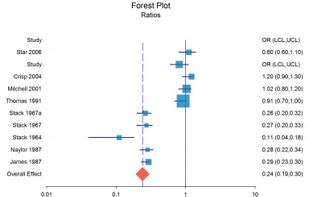
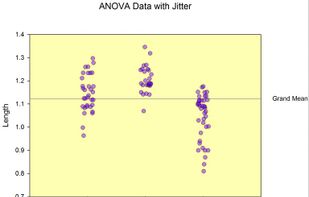
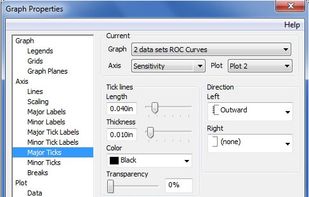
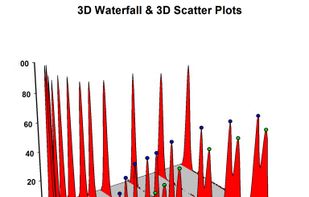


Curasynth is an AI-powered research platform designed to streamline and automate various aspects of academic and clinical research, from writing and data analysis to protocol generation. It provides an all-in-one platform for researchers to increase efficiency and reduce the...



MagicPlot is cross-platform application for scientific and engineering plotting, non-linear and multipeak curve fitting and batch processing. MagicPlot produces high-quality plots and offers handy plot navigation. Project files have .mppz extention.
United States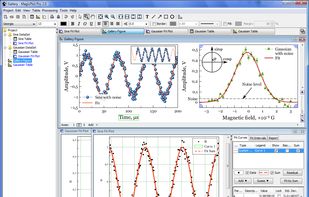

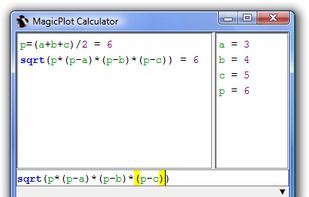
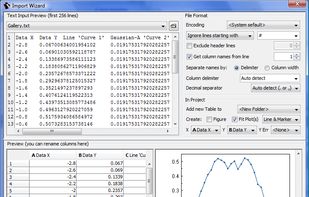


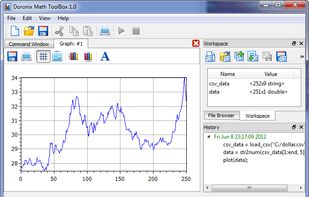
Doronix Math Toolbox is a numerical computing environment with programming language which can be used as alternative to MATLAB. It allows matrix manipulations, plotting of functions and data, implementation of algorithms, creation of user functions, import and export CSV-files...

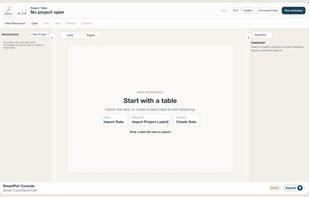
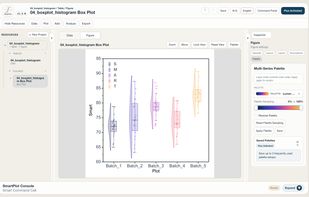
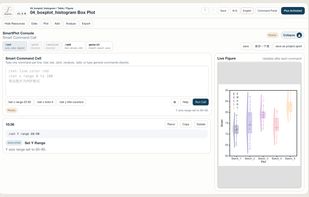
SmartPlot is a desktop scientific plotting and data analysis application designed for researchers who want a direct workflow from data tables to editable, publication-ready figures.
 Hong Kong SAR China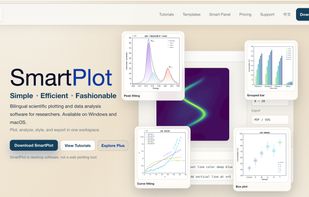


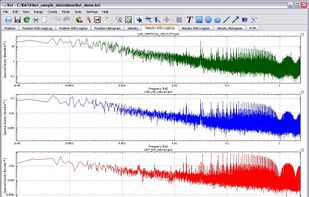
Kst is a fast, real-time large-dataset viewing and plotting tool available and has built-in data analysis functionality.