
StatLite icon
StatLite icon

StatLite

A tiny self-hosted metrics dashboard for small servers. Spring Boot Actuator monitoring with SQLite, simple charts, and no Prometheus/Grafana stack required.
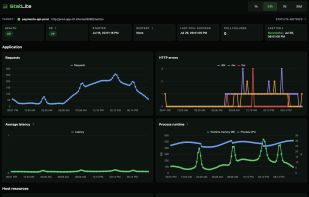
Dashboard screen

Cost / License

  • Free
  • Open Source (MIT)

Platforms

  • Self-Hosted
  • Docker
2likes
0comments
0articles

Features

  1.  Dashboard
  2.  VPS
  3.  SQLite
  4.  Metrics

StatLite News & Activities

Highlights All activities

Recent activities

StatLite information

  • Developed by

    US flagPVRLabs
  • Licensing

    Open Source (MIT) and Free product.
  • Written in

  • Alternatives

    1 alternatives listed
  • Supported Languages

    • English

GitHub repository

  •  98 Stars
  •  2 Forks
  •  3 Open Issues
  •   Updated  
View on GitHub

Popular alternatives

View all
StatLite was added to AlternativeTo by PVRLabs on and this page was last updated .
No comments or reviews, maybe you want to be first?

What is StatLite?

A lightweight, self-hosted metrics dashboard with a small memory and operational footprint, designed for applications running on VPSs and small servers. A single Go binary monitors Spring Boot applications through Actuator and other applications that expose a small, fixed JSON metrics endpoint, without requiring Prometheus or Grafana. It stores focused health, traffic, latency, CPU, memory, and optional host metrics in SQLite.

StatLite reads the Actuator data you already have and shows the operational signals most useful during routine checks.

Official Links
