
SPX
SPX, which stands for Simple Profiling eXtension, is just another profiling extension for PHP. It differentiates itself from other similar extensions as being: totally free and confined to your infrastructure (i.e. no data leaks to a SaaS).
Cost / License
- Free
- Open Source (GPL-3.0)
Platforms
- Mac
- Linux
Features
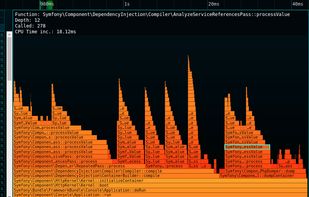
- Waterfall Chart
- Web-Based
- POSIX-style
Tags
SPX News & Activities
Recent activities
SPX information
What is SPX?
A simple & straight-to-the-point PHP profiling extension with its built-in web UI - NoiseByNorthwest/php-spx
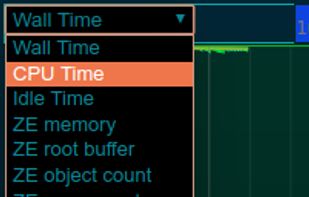
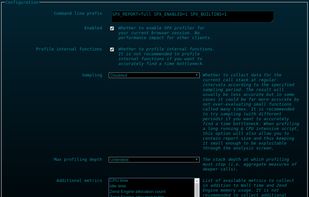
totally free and confined to your infrastructure (i.e. no data leaks to a SaaS). very simple to use: just set an environment variable (command line) or switch on a radio button (web page) to profile your script. Thus, you are free of: manually instrumenting your code (Ctrl-C a long running command line script is even supported). using a dedicated browser extension or command line launcher. multi metrics capable: 21 currently supported (various time metrics, memory, included files, objects in use, I/O...). able to collect data without losing context. For example Xhprof (and potentially its forks) aggregates data per caller / callee pairs, which implies the loss of the full call stack and forbids timeline or Flamegraph based analysis. shipped with its web UI which allows to: enable / configure profiling for the current browser session list profiled script reports select a report for in-depth analysis, featuring these interactive visualizations: timeline (scale to millions of function calls) flat profile Flamegraph


Comments and Reviews
Simple to install locally, and gives a detailed waterfall graph of php functions walltime and memory usage