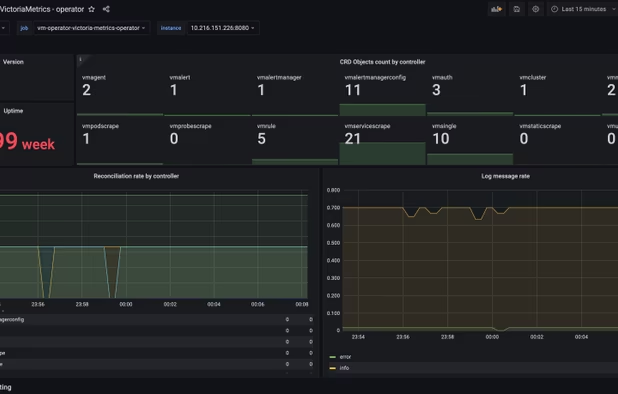
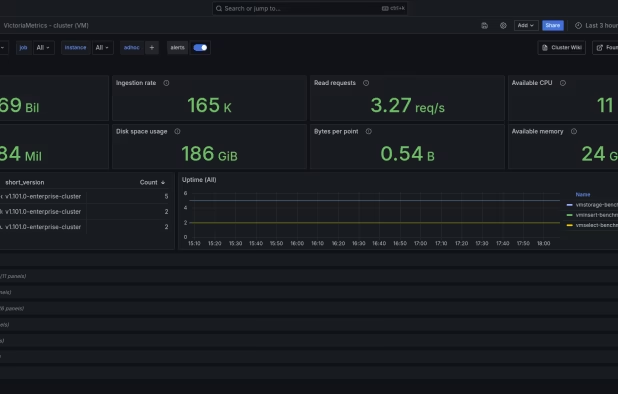
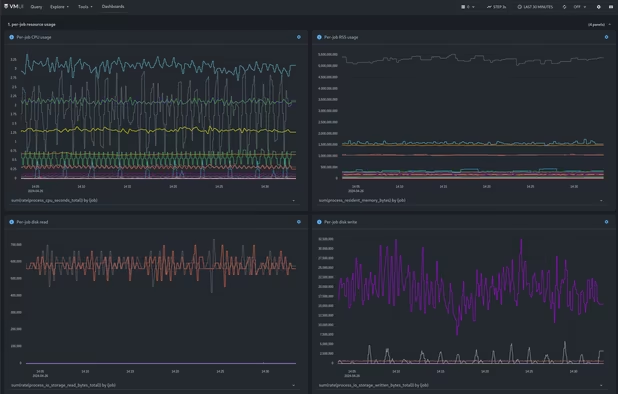
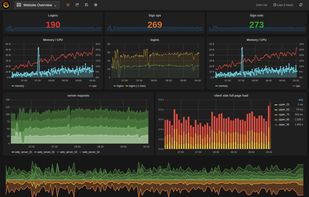
Grafana provides a powerful and elegant way to create, explore, and share dashboards and data with your team and the world.
Platforms
- Mac
- Windows
- Linux
- BSD
- Self-Hosted
- Cloudron
- Docker
- Node.JS
 Sweden
 EU



+1


The best open source alternative to Splunk is Grafana. If that doesn't suit you, our users have ranked more than 100 alternatives to Splunk and many of them is open source so hopefully you can find a suitable replacement. Other interesting open source alternatives to Splunk are Wazuh, Prometheus, HyperDX and Logstash.
Grafana provides a powerful and elegant way to create, explore, and share dashboards and data with your team and the world.
SwedenEU
Wazuh is a free and open source platform used for threat prevention, detection, and response. It is capable of protecting workloads across on-premises, virtualized, containerized, and cloud-based environments.


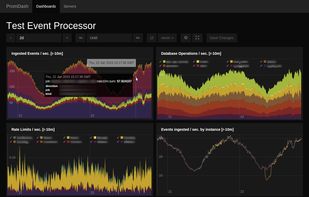
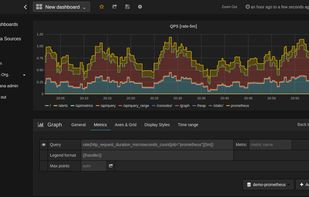
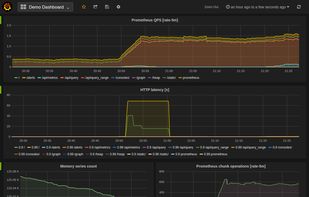
Prometheus is an open-source systems monitoring and alerting toolkit originally built at SoundCloud. Since its inception in 2012, many companies and organizations have adopted Prometheus, and the project has a very active developer and user community.


Logstash is an open source, server-side data processing pipeline that ingests data from a multitude of sources simultaneously, transforms it, and then sends it to your favorite "stash.".
 NetherlandsEU
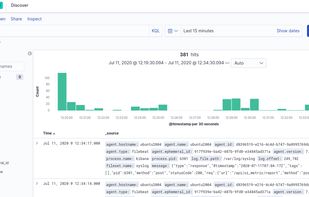
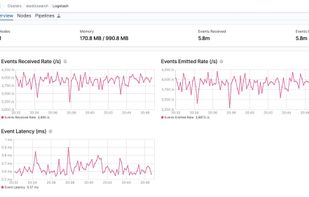
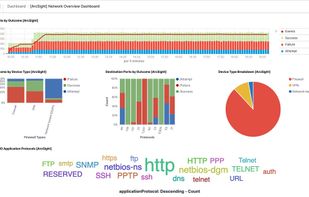


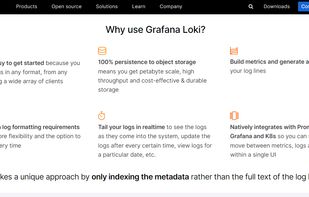
Grafana Loki is a horizontally-scalable, highly-available, multi-tenant log aggregation system inspired by Prometheus. It is designed to be very cost effective and easy to operate. It does not index the contents of the logs, but rather a set of labels for each log stream.
SwedenEU


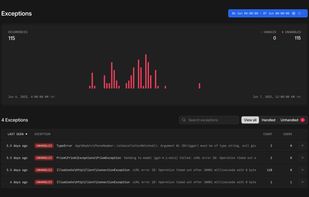
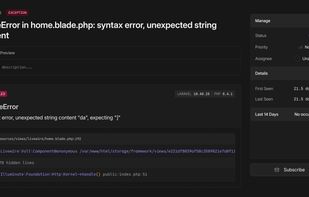
Tracks event timelines, grouped exception alerts, log searches, SQL query and job performance, third-party integrations, notifications, cache patterns, and scheduled tasks across any Laravel deployment, offering comprehensive health insights and instant setup.
 United States



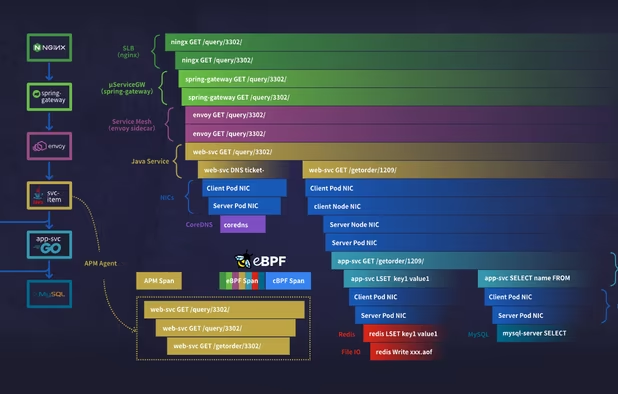
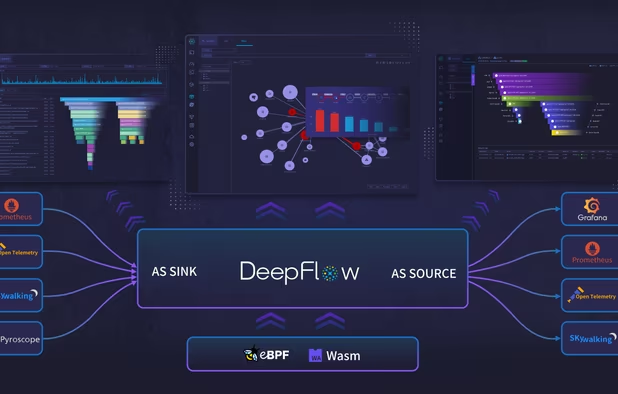
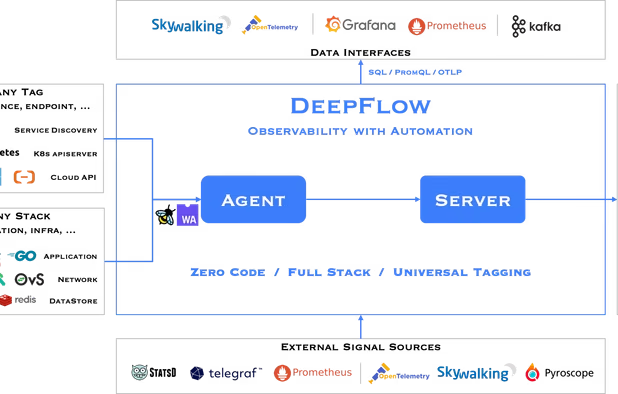
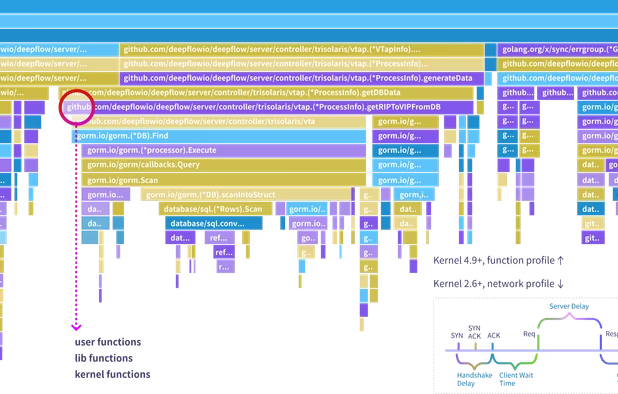
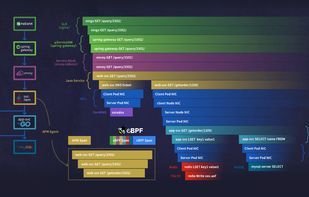
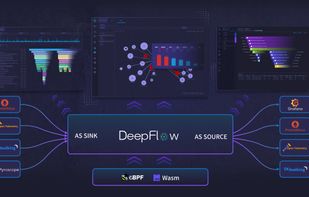
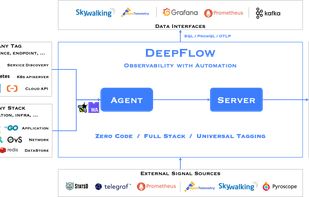
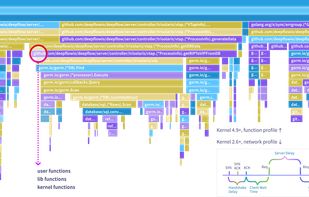
Unify your cloud-native monitoring with zero-code eBPF, advanced profiling, and 10x storage efficiency.
 China


Goxe is a high-performance log reduction tool written in Go, designed to reduce noise in observability pipelines. It ingests logs via Syslog/UDP, normalizes and filters them, and aggregates identical or repetitive messages into a single-line format with occurrence counts.
 Venezuela


VictoriaLogs, an open-source log database from VictoriaMetrics, is designed to be user-friendly. It seamlessly integrates with widely used log collectors and offers a more straightforward setup process than Elasticsearch and Grafana Loki.
United States


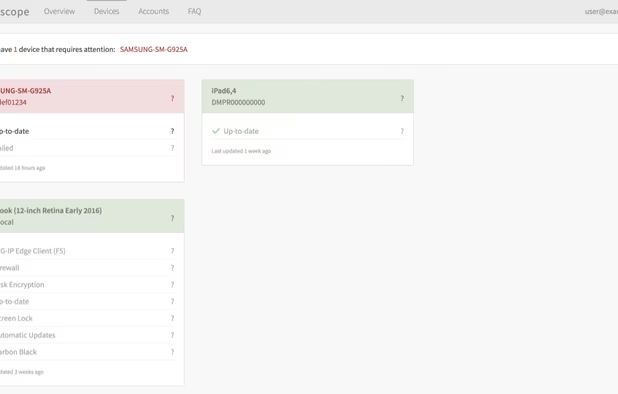
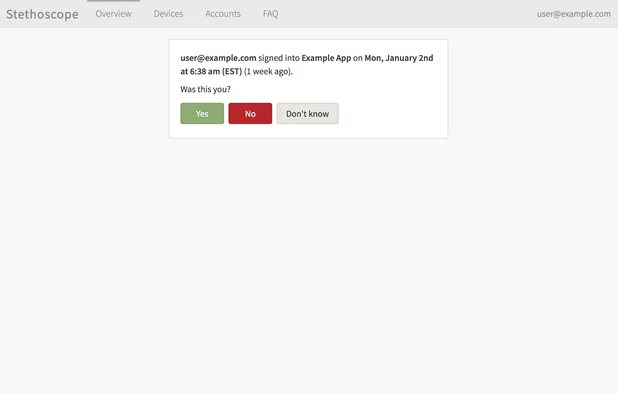
Stethoscope is a personalized security recommendation tool made by Netflix for employees.
United States