Java based and open sourced version of matlab and octave
Getting more and more compatible over time.
Platforms
- Android


python(x,y) has been discontinued. Similar apps include MATLAB. It's paid, but GNU Octave and SageMath are free. Other options are Mathematica, GeoGebra, Anaconda and SciPy. You're spoiled for choice with Numerical Computation Software like python(x,y): we list more than 50 alternatives for Windows, Mac, Linux, the web and iPad.
Java based and open sourced version of matlab and octave
Getting more and more compatible over time.


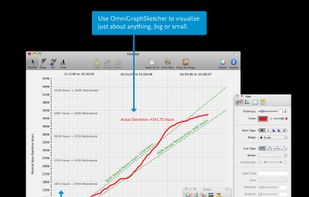
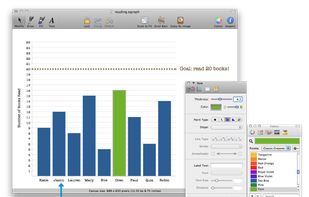
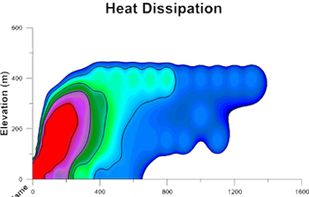
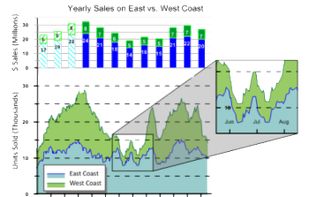
OmniGraphSketcher helps you make elegant and precise graphs in seconds, whether you have specific data to visualize or you just have a concept to explain. Specifically designed for reports, presentations, and problem sets where you need to produce sharp-looking graphs on the...
 United States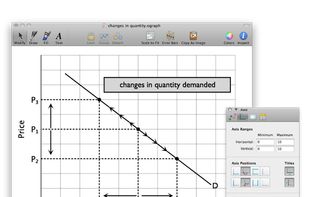
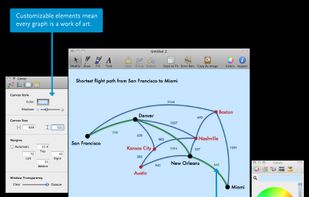


With Grapher, you can graph equations and data sets and visualize the results on your Mac in real time. Grapher displays algebraic relations, both implicit and explicit, in 2D and 3D. You can use a variety of coordinate systems and choose from a wide array of mathematical...
United States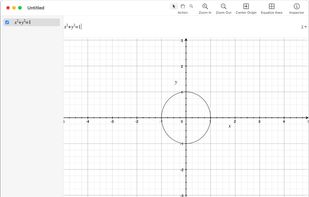


Grapher is the ultimate technical graphing package available. This easy-to-use, powerful, dynamic program will help you create superior publication-quality professional graphs in minutes!.
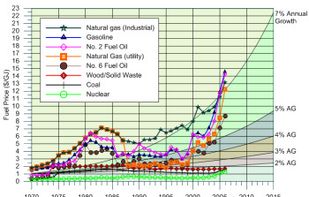


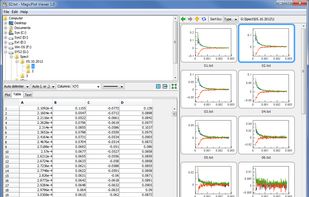
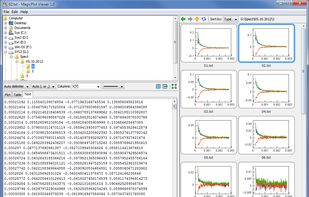
MagicPlot Viewer is a unique cross-platform application for viewing plots and thumbnails from multiple text/ASCII files.
United States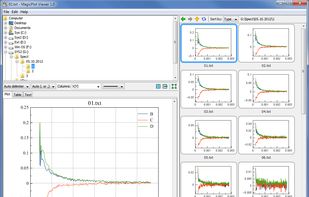


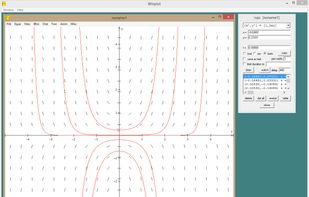
"Winplot is a free graphing utility that was written by Richard Parris, a math instructor at Phillips Exeter Academy in Exeter, New Hampshire. Sadly Richard passed away in 2012. After Richard's death the program was still available for a number of years on the Exeter...


A simple plotter and numerical solver, which can plot CSV style plain text files with numerical data separated by whitespace, as well can numerically solve equations and ODEs to generate data and plot them for studying dynamical systems.


 Italy
Italy EU
EU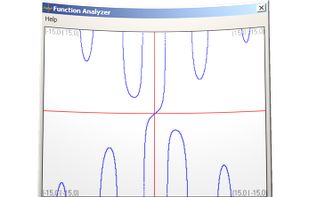

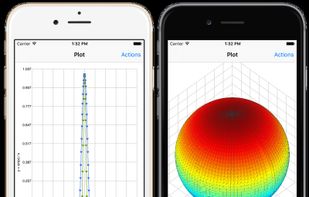
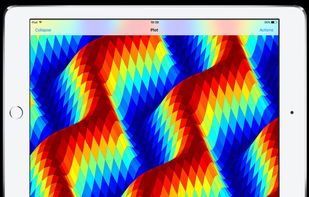
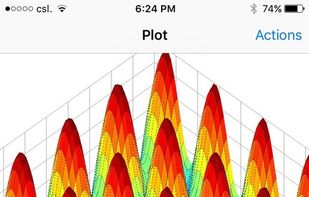
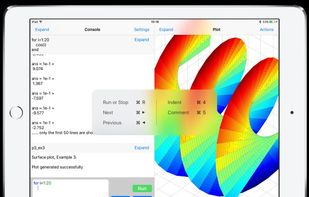
SIMO is an iOS programming environment for Matlab. SIMO runs locally on device and hence internet connection is not required. Users can create, edit and run Matlab code, and create 2D and 3D plots. Find out more: http://www.simo.com.hk/.


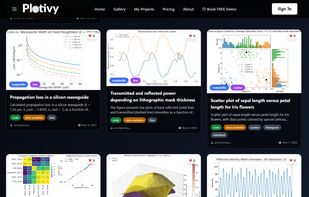
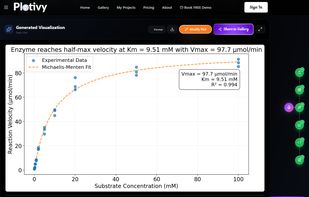
Plotivy is a modern, AI-assisted platform designed specifically for scientific data visualization and image analysis. Built by an experimental physicist for researchers who want to focus on science rather than wrestling with plotting libraries.
ItalyEU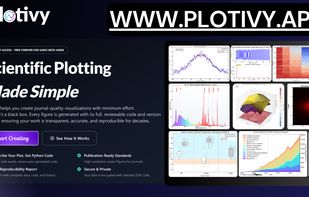



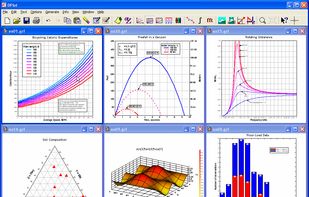
DPlot graphing software lets scientists and engineers graph, plot, analyze, and manipulate data.