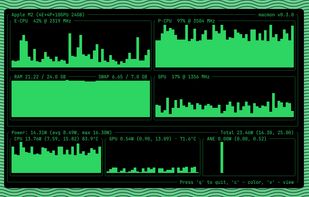
Resource monitor that shows usage and stats for processor, memory, disks, network and processes.
Cost / License
- Free
- Open Source (Apache-2.0)
Application typeApplication types
Platforms
- Mac
- Linux
- FreeBSD


+4


Process Explorer is not available for Mac but there are plenty of alternatives that runs on macOS with similar functionality. The best Mac alternative is btop++, which is both free and Open Source. If that doesn't suit you, our users have ranked more than 50 alternatives to Process Explorer and many of them are available for Mac so hopefully you can find a suitable replacement. Other interesting Mac alternatives to Process Explorer are witr, Glances, BPYTOP and Pachtop.
Resource monitor that shows usage and stats for processor, memory, disks, network and processes.

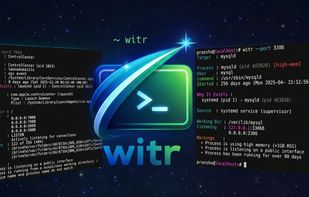
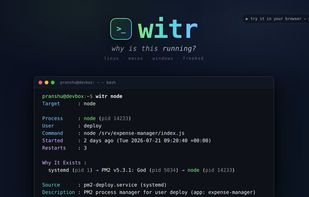
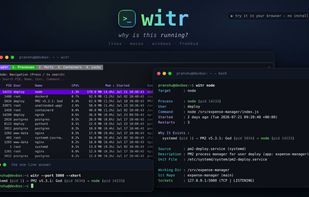
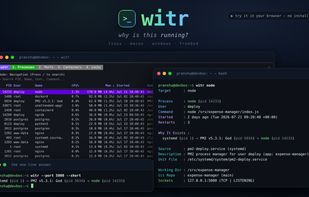
CLI diagnostic tool for tracing processes and their causal ancestry, explaining origins, supervising service, context like directories and containers, risk signals, with support for Linux, macOS, Windows, FreeBSD, platform-specific inspection, JSON output, and open licensing.


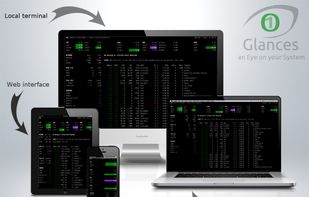
Glances is a cross-platform monitoring tool which aims to present a large amount of monitoring information through a curses or Web based interface. The information dynamically adapts depending on the size of the user interface.
 France
 EU
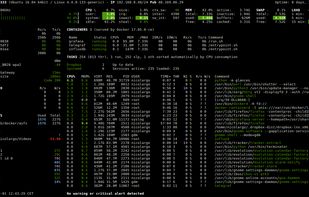
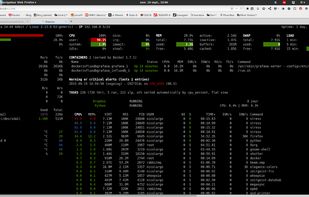
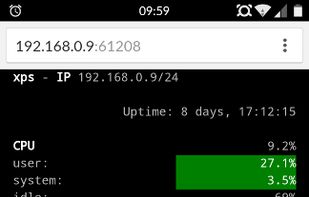


Resource monitor that shows usage and stats for processor, memory, disks, network and processes.
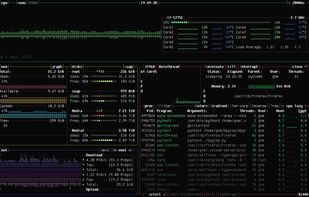
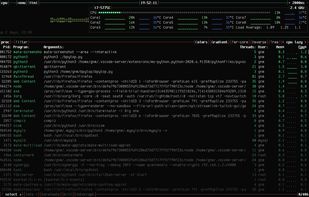
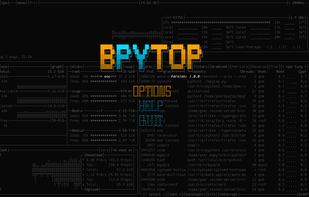
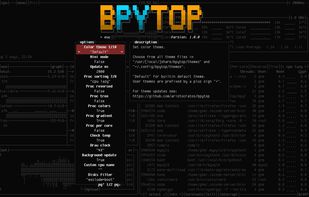
Python port of bashtop.


Pachtop is a lightweight, performant, and opensource system monitor that provides real-time monitoring of your system's performance, application monitoring, and detailed system information. Built with Rust and Tauri
 Philippines


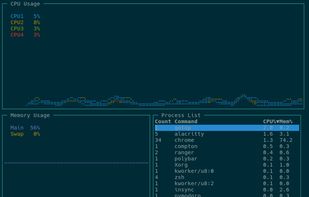
ca. 2020-01-25 The original author of gotop started a new tool in Rust, called ytop, and deprecated his Go version. This repository is a fork of original gotop project with a new maintainer to keep the project alive and growing.


 SlovakiaEU
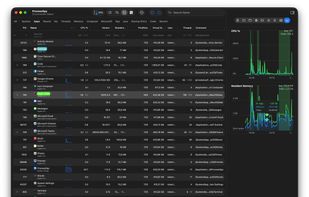
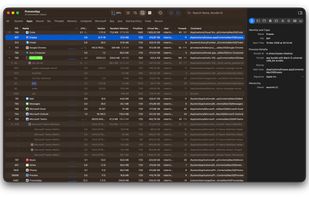


Provides real-time statistics for CPU, memory, disk, and network usage on macOS, allows users to view, organize, and terminate processes, analyze system resource consumption, view data in graphs and tables, check current transfers, and monitor system health.
 United States
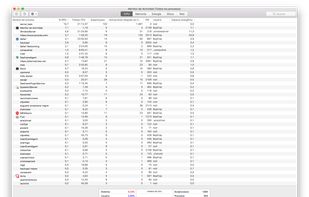
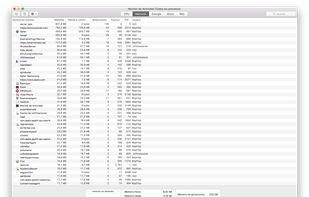
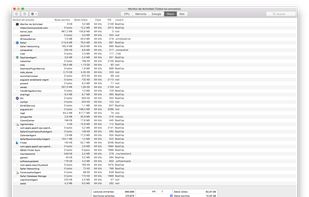



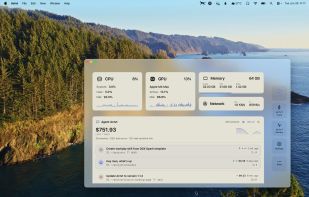
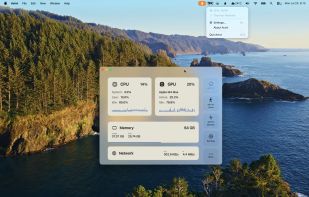
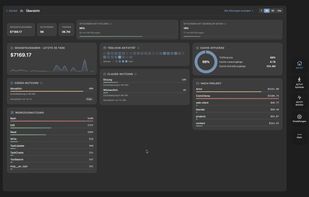
Native macOS app displays live CPU, GPU, memory, and network usage with history, manages and reclaims ports, tracks AI coding agent sessions in detail, enables local and remote monitoring, provides comprehensive notifications, and secures scanned data.
FranceEU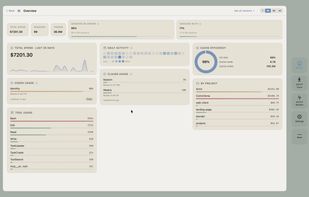


Explore all the tasks (processes) running on your Mac with TaskExplorer. Quickly see a task's signature status, loaded dylibs, open files, network connection, and much more!.
United States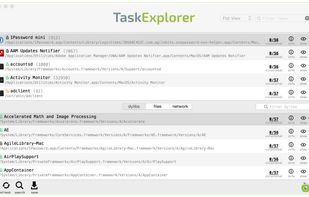




Get real-time Apple Silicon performance data without sudo, including CPU, GPU, RAM usage, power and temperature metrics, per-cluster utilization, RAM and swap stats, historical charts, color themes, and detailed system information directly via CLI.