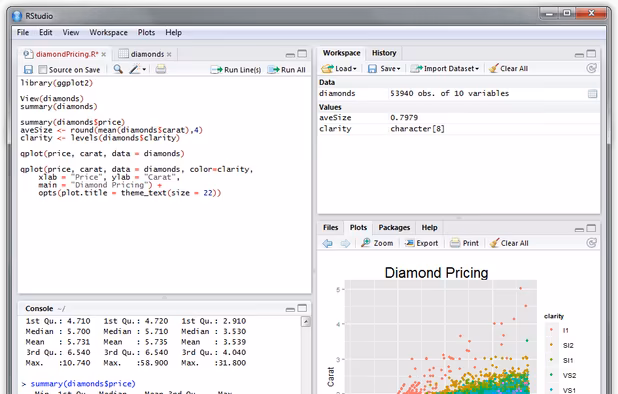
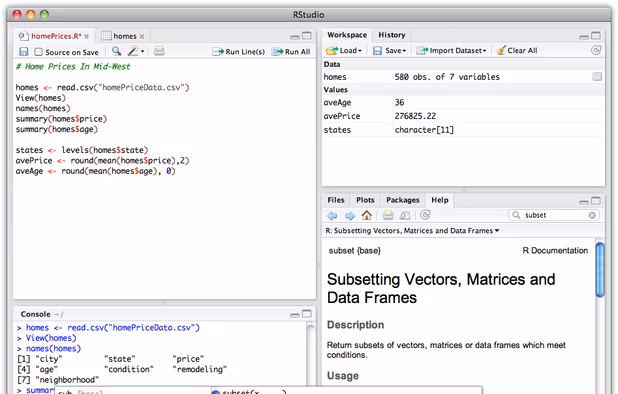
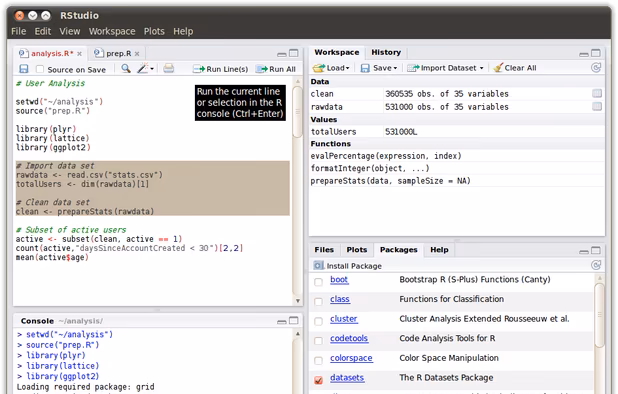
RStudio™ is an integrated development environment (IDE) for R. RStudio combines an intuitive user interface with powerful coding tools to help you get the most out of R.
+1
OfficeReports is described as 'Suite of Microsoft Office add-ins that streamlines survey data analysd automated report generation directly within Excel and PowerPoint. Built for market researchers and insights professionals, it eliminates copy-paste workflows and manual formatting by' and is a statistical analyzer in the business & commerce category. There are more than 10 alternatives to OfficeReports for a variety of platforms, including Windows, Mac, Linux, Web-based and Xfce apps. The best OfficeReports alternative is RStudio, which is both free and Open Source. Other great apps like OfficeReports are PSPP, IBM SPSS Statistics, Minitab and Stata.
RStudio™ is an integrated development environment (IDE) for R. RStudio combines an intuitive user interface with powerful coding tools to help you get the most out of R.
PSPP is a free software application for analysis of sampled data. It has a graphical user interface and conventional command line interface. It is written in C, uses GNU Scientific Library for its mathematical routines, and plotutils for generating graphs.

The IBM SPSS software platform offers advanced statistical analysis, a vast library of machine-learning algorithms, text analysis, open-source extensibility, integration with big data and seamless deployment into applications.


Minitab is a comprehensive statistical software package designed for analyzing data in Lean Six Sigma and statistics education, offering tools for quality and process improvement, making it ideal for various educational and professional uses.


Data Analysis and Statistical Software for Professionals.
Stata is a complete, integrated statistical package that provides everything you need for data analysis, data management, and graphics. Stata is not sold in pieces, which means you get everything you need in one package.


Statwing was built by and for analysts, so you can clean data, explore relationships, and create charts in minutes instead of hours. Simply upload your spreadsheet or dataset, then select the relationships you want to explore.


MonteCarlito is a free Excel-add-in to do Monte-Carlo-simulations. Apart from these it can also do statistical analysis like mean, median, standard error, variance, skewness, kurtosis. It can create histograms. The code is open source.

MarketSight® is a web-based data analysis platform for analyzing and visualizing survey results and other market data. It is ideal for creating crosstabs, automatically running statistical tests, creating charts, designing and hosting dashboards, viewing and editing data...
Transforms collected data from Excel and SPSS into visual PowerPoint reports, automates updates with new data, supports advanced charting, conditional analysis, team collaboration, secure sharing, and ensures the latest analytics sync seamlessly with the presentation workspace.


SageBow's autonomous AI agents deploy directly into your Python environment and execute end-to-end tasks.


