MultiYaxis icon
MultiYaxis icon

MultiYaxis

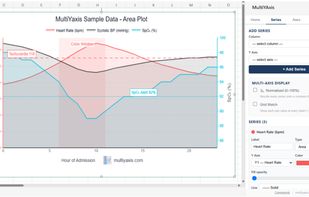
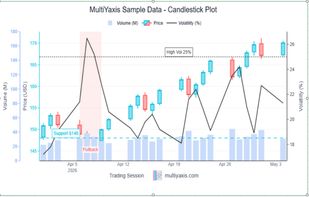
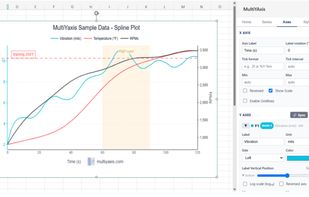
Excel charting tool for multi-parameter data with unlimited independent Y axes, custom scales, units, colors, and positions. Mix line, spline, area, bar, and scatter series, apply transforms or normalization, add annotations and reference regions, then export high-resolution images.
MultiYaxis screenshot 1

Cost / License

  • Freemium (Pay once or Subscription)
  • Proprietary

Platforms

  • Windows
  • Microsoft Excel
  • Mac
  • Microsoft 365 (Office)
MultiYaxis screenshot 1
MultiYaxis screenshot 2
Alternatives
0likes
0alternatives
0articles
Save

Features

  1.  Live Preview
  2.  Chart editor
  3.  Charts
  4.  Fullscreen support
  5.  Export to PDF
  6.  Data visualization
  7.  Export to SVG
  8.  Excel Add-in
  9.  Document Annotations

MultiYaxis News & Activities

Highlights All activities

Recent activities

MultiYaxis information

  • Developed by

    US flagPs25 Labs LLC
  • Licensing

    Proprietary and Freemium product.
  • Pricing

    One time purchase that costs from $530, and / or subscription ranging between $180 and $3500 per year + free version with limited functionality.
  • Alternatives

    0 alternatives listed
  • Badge

    Get an embeddable badge for MultiYaxis
  • Supported Languages

    • English

AlternativeTo Category

Development
MultiYaxis was added to AlternativeTo by one44him on and this page was last updated .

No comments or reviews, maybe you want to be first?

Official Links

What is MultiYaxis?

MultiYAxis is a software tool for adding unlimited independent Y axes to an Excel chart. Each Y axis can be adjusted for scale, units, color, and position. It's useful for professionals working with multi-parameter data.

The free tier of MultiYAxis allows users to add up to 3 Y axes with full charting controls, save templates, and export watermarked charts without needing an account. It offers unlimited independent Y axes, five chart types: line, spline, area, bar, and scatter, and per-series scale and offset transforms.

Other features include a normalized mode for cross-unit comparison, reference lines, shaded regions, annotations, 8 color palettes, per-series color overrides, full text styling, flexible axis label placement, high-resolution export options, and the ability to insert charts into Excel as native images. Users can save and load chart templates, and a 20-level undo/redo feature is available. The software also includes a statistics panel and a live full-screen preview with zoom.