The Debug Diagnostic Tool (DebugDiag) is designed to assist in troubleshooting issues such as hangs, slow performance, memory leaks or memory fragmentation, and crashes in any user-mode process.
Cost / License
- Free
- Proprietary
 United States
Platforms
- Windows
D


Apps similar to MemoScope.Net include Debug Diagnostic Tool, which is free. Other options are .NET Memory Profiler. Between them they cover Windows.
The Debug Diagnostic Tool (DebugDiag) is designed to assist in troubleshooting issues such as hangs, slow performance, memory leaks or memory fragmentation, and crashes in any user-mode process.

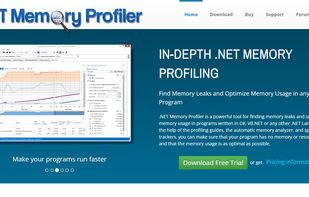
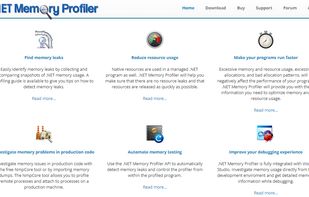
.NET Memory Profiler is a powerful tool for finding memory leaks and optimizing the memory usage in programs written in C#, VB.NET or any other .NET Language.
 Sweden
 EU
EU