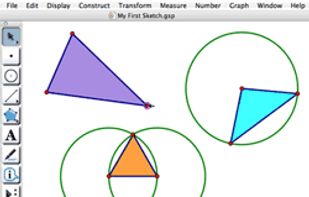
Sketchpad® Dynamic Geometry® software gives students a tangible, visual way to learn mathematics that increases their engagement, understanding, and achievement. And it's not just for geometry.
Cost / License
- Paid
- Proprietary
Platforms
- Mac
- Windows


Graph has been discontinued. Similar apps include R (programming language), which is free and open source. Other options are SageMath, Matplotlib, GeoGebra and GnuPlot. You're spoiled for choice with Calculators like Graph: we list more than 50 alternatives for Windows, Mac, Linux, the web and iPad.
Sketchpad® Dynamic Geometry® software gives students a tangible, visual way to learn mathematics that increases their engagement, understanding, and achievement. And it's not just for geometry.

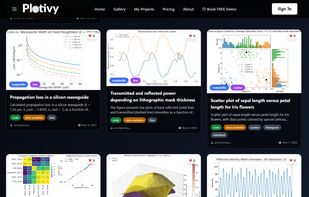
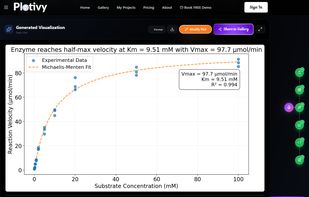
Plotivy is a modern, AI-assisted platform designed specifically for scientific data visualization and image analysis. Built by an experimental physicist for researchers who want to focus on science rather than wrestling with plotting libraries.
 Italy
Italy EU
EU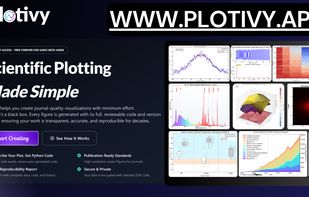



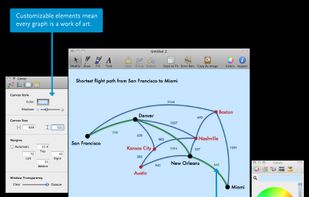
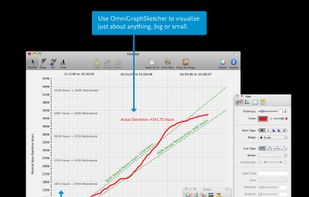
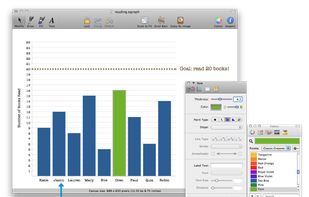
OmniGraphSketcher helps you make elegant and precise graphs in seconds, whether you have specific data to visualize or you just have a concept to explain. Specifically designed for reports, presentations, and problem sets where you need to produce sharp-looking graphs on the...
 United States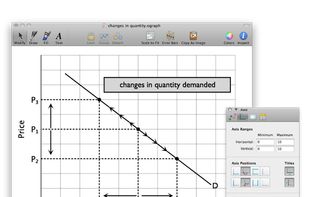


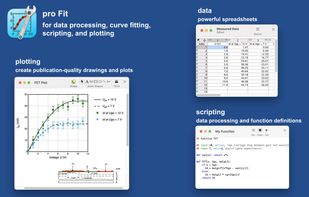
pro Fit, the best curve fitting, regression, plotting, data analysis for macOS. Python and LaTeX support, publication quality plots.


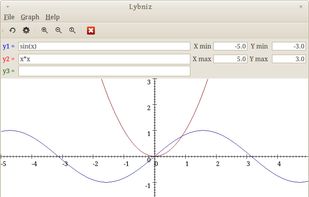
Lybniz is a simple and very easy to use mathematical function graph plotter written in Python and GTK. Expressions are entered in Python syntax.


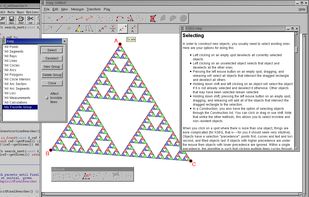
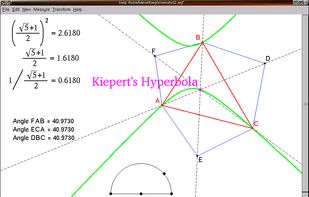
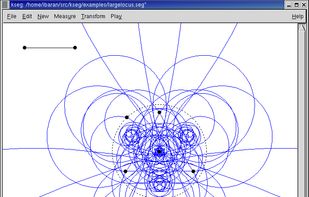
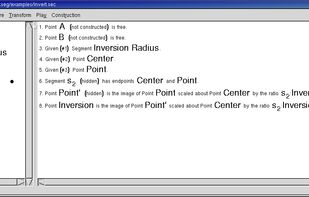
KSEG is a free interactive geometry program for exploring Euclidean geometry. It runs on Unix-based platforms (according to users, it also compiles and runs on Mac OS X and should run on anything that Qt supports).


The Enthought Python Distribution provides scientists with a comprehensive set of tools to perform rigorous data analysis and visualization. Python, distinguished by its flexibility, coherence, and ease-of-use, is rapidly becoming the programming language of choice for...


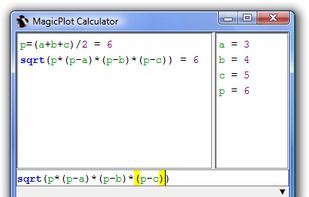
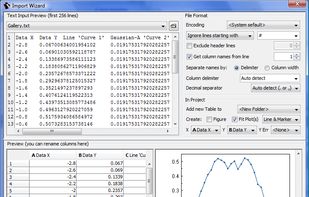
MagicPlot is cross-platform application for scientific and engineering plotting, non-linear and multipeak curve fitting and batch processing. MagicPlot produces high-quality plots and offers handy plot navigation. Project files have .mppz extention.
United States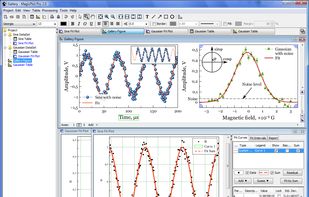


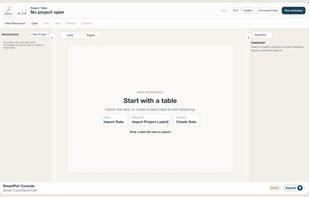
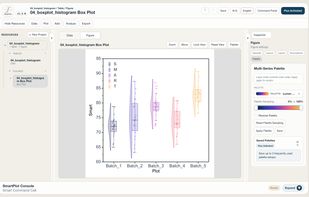
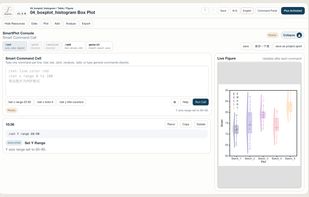
SmartPlot is a desktop scientific plotting and data analysis application designed for researchers who want a direct workflow from data tables to editable, publication-ready figures.
 Hong Kong SAR China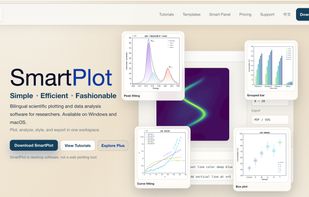


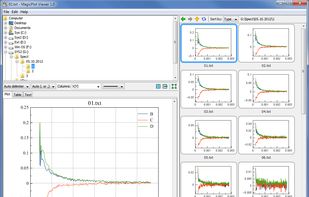
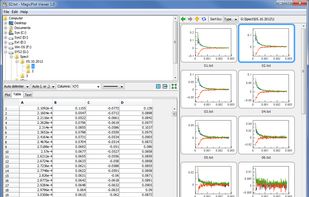
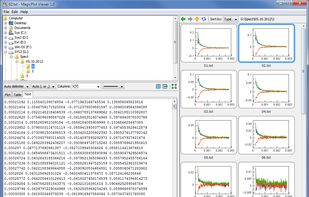
MagicPlot Viewer is a unique cross-platform application for viewing plots and thumbnails from multiple text/ASCII files.
United States