Digma
The Digma IntelliJ plugin profiles your code execution in runtime, to find the root cause of bottlenecks, scaling problems, and db query issues.
Cost / License
- Freemium (Subscription)
- Open Source
Platforms
- IntelliJ IDEA
- Windows
- Mac
- Linux
Features
- Continuous Testing
- AI-Powered
Digma News & Activities
Recent activities
Digma information
What is Digma?
The Digma IntelliJ plugin profiles your code execution in runtime, to find the root cause of bottlenecks, scaling problems, and db query issues.
A plugin that shows you where your code fails
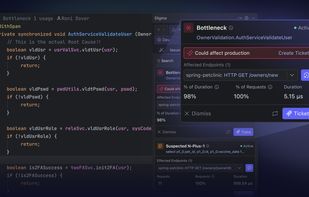
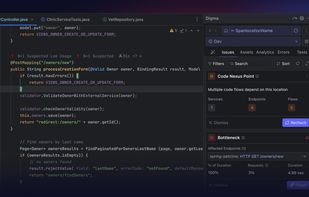
Digma integrates into your IDE to highlight issues, regressions, and problems, as you code. Immediately see how any function scales in CI or production and spot issues while still in development.
Untangling legacy and complex systems
Accelerate code changes and avoid endless regressions. By analyzing how the code performs, Digma provides critical analytics on usage, errors, and performance to make sense of forgotten code and ownerless libraries.
Identify what’s slowing your application down
Immediately understand what’s causing bottlenecks and slowdowns in your code. With valuable data such as code execution times, scaling limitations, and N+1 query issues – you can quickly fix it.
Enhances your GitOps cycle
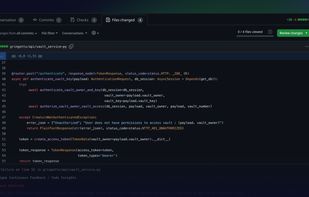
Pull Request feedback and code review annotation get way easier when your team integrates Digma into your GitOps cycle.
Like it or not, it’s your code now
Whether you inherited code someone else wrote or code you haven’t worked on in a while, it’s your problem from now on. Digma lets you understand it and start working on it fearlessly – no matter how large or complex.
Enhanced Observability for Developers
Digma collects code runtime data using OpenTelemetry behind the scenes. It allows developers to effortlessly find problematic areas of code, pinpoint bottlenecks, prioritize errors that affect the end user, track down where a particular function is called from, and find out whether it’s being used.


