C3.js Alternatives

Sites and apps similar to C3.js include D3.js, which is free and open source. Other options are Plotly, Chart.js, Google Charts and liveGap Charts. There's no shortage of Charting Library Tools like C3.js, with more than 25 alternatives for self-hosting, Mac, Windows, Linux and iPhone.

Copy a direct link to this comment to your clipboard
Alternatives
C3.js alternatives page was last updated

Alternatives list

  1. AnyChart icon
     18 likes

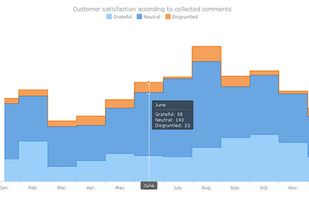
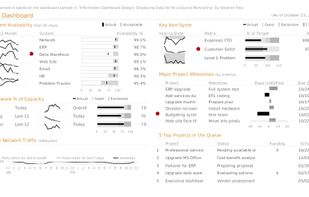
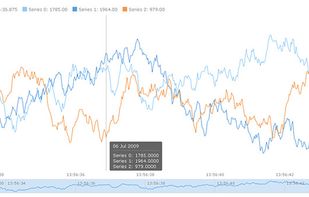
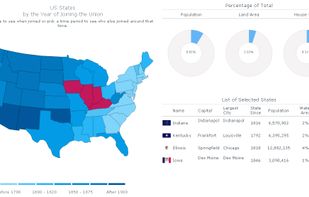
    Flexible, cross-platform and cross-browser JavaScript (HTML5) charting library that allows you to create interactive bar, pie, line, spline, area, Gantt, stock and other charts, maps and dashboards, with real-time updates and multi-level drill-downs.

    Cost / License

    • Pay once
    • Proprietary

    Since

    • Since 2015

    Platforms

    • Windows
    • Mac
    • Linux
    • Online
    • Self-Hosted
    • Android
    • iPhone
    Good alternative?
     
  2. Vis.js icon
     5 likes

    vis.js is a dynamic, browser based visualization library. The library is designed to be easy to use, to handle large amounts of dynamic data, and to enable manipulation of and interaction with the data.

    Cost / License

    • Free
    • Open Source

    Since

    • Since 2015

    Platforms

    • Self-Hosted
    Good alternative?
     
  3. dc.js icon
     5 likes

    dc.js is a JavaScript charting library with native Crossfilter support and allowing highly efficient exploration on large multi-dimensional dataset (inspired by Crossfilter 's demo). It leverages d3 engine to render charts in CSS friendly SVG format. Charts rendered using dc.

    Cost / License

    • Free
    • Open Source

    Application type

    Since

    • Since 2012

    Platforms

    • Online
    Good alternative?
     
  4. amCharts icon
     3 likes

    amCharts is an advanced charting library that will suit any data visualization need. Our charting solution include Column, Bar, Line, Area, Step, Step without risers, Smoothed line, Candlestick, OHLC, Pie/Donut, Radar/ Polar, XY/Scatter/Bubble, Bullet, Funnel/Pyramid charts as...

    Cost / License

    • Freemium
    • Proprietary

    Since

    • Since 2015

    Platforms

    • Online
    • Self-Hosted
    Good alternative?
     
  5. Webix UI  icon
     17 likes

    JavaScript Library / HTML5 UI framework for developers with SpreadSheet, Pivot, Kanban, FileManager, Scheduler, Datatable, TreeTable and etc. widgets.

    Cost / License

    Application type

    Since

    • Since 2014

    Platforms

    • Windows
    • Mac
    • Linux
    • Chrome OS
    • Android
    • iPhone
    • iPad
    • Android Tablet
    • Windows Phone
    • Blackberry 10
    Good alternative?
     
  6.  2 likes

    jqPlot is a plotting and charting plugin for the jQuery Javascript framework. jqPlot produces beautiful line, bar and pie charts with many features

    Cost / License

    • Free
    • Open Source

    Since

    • Since 2012

    Platforms

    • Online
    Good alternative?
     
  7. KeyLines is a JavaScript toolkit used by developers to build powerful network visualization applications, quickly.

    Cost / License

    • Subscription
    • Proprietary

    Application type

    Since

    • Since 2014

    Platforms

    • Windows
    • Mac
    • Linux
    • Online
    • Android
    • iPhone
    • iPad
    • Android Tablet
    Good alternative?
     
  8.  1 like

    ggvis is a data visualization package for R which lets you create rich interactive graphics that you can play with locally in Rstudio or in your browser, using a syntax similar in spirit to ggplot2.

    Cost / License

    • Free
    • Open Source

    Since

    • Since 2016

    Platforms

    • Windows
    • Mac
    • Linux
    • Online
    Good alternative?
     
  9. ZingChart icon
     11 likes

    ZingChart is a JavaScript charting library with no dependencies that is built for big data. The library can handle huge data sets without breaking, crashing, or sacrificing interactivity. As a dependency-free library, no additional plugins are required.

    Cost / License

    • Paid
    • Proprietary

    Application type

    Since

    • Since 2012

    Platforms

    • Online
    Good alternative?
     
  10. FusionCharts Suite XT helps you create interactive JavaScript charts, gauges and maps in a jiffy for all your web, mobile and enterprise applications. Using it, you can build awesome dashboards, reports, analytics, monitors, surveys that blend aesthetic elegance and actionable...

    Cost / License

    • Paid
    • Proprietary

    Since

    • Since 2009

    Platforms

    • Windows
    • Mac
    • Linux
    • Online
    • Android
    • iPhone
    • iPad
    • Android Tablet
    • Blackberry
    Good alternative?
     
  11. ECharts icon
     1 like

    ECharts is an open-sourced JavaScript visualization tool, which can run fluently on PC and mobile devices. It is compatible with most modern Web Browsers, e.g., IE8/9/10/11, Chrome, Firefox, Safari and so on.

    Cost / License

    Since

    • Since 2019

    Platforms

    • Online
    Good alternative?
     
  12.  1 like

    Flot is a pure Javascript plotting library for jQuery. It produces graphical plots of arbitrary datasets on-the-fly client-side.

    Cost / License

    • Free
    • Proprietary

    Since

    • Since 2011

    Platforms

    • Windows
    • Mac
    • Linux
    • jQuery
    Good alternative?
     
You are at page 2 of C3.js alternatives