Apps tagged with 'Memory Profiling'

All apps in Apps tagged with 'Memory Profiling' category. Use the filters below to narrow down your search. 
Copy a direct link to this comment to your clipboard
  1. JustTrace is Telerik’s 2-in-1 memory and performance profiler for .NET. JustTrace profiles .NET apps to pinpoint and assist in resolving memory leaks and performance problems which may damage application quality.

    Cost / License

    • Paid
    • Proprietary

    Since

    • Since 2013

    Alerts

    • Discontinued

    Platforms

    • Windows
    • US flagUnited States
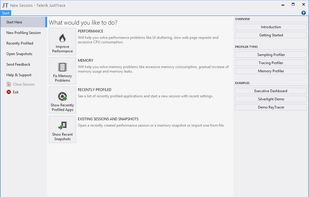
    JustTrace Start Screen
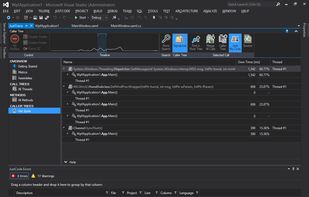
    JustTrace Visual Studio Color Support
    10 alternatives
  2. With dotTrace Memory, you can quickly profile the memory usage of your applications based on .NET Framework up to version 4. The profiling process is not only simple but fast. A wealth of profiling data is accurately recorded and presented in the form of memory snapshots...

    Cost / License

    • Paid
    • Proprietary

    Since

    • Since 2011

    Platforms

    • Windows
  3. Skylight.io icon
     1 like

    Skylight visualizes all your app’s performance data in a way that makes it easy to understand and act on.

    Cost / License

    • Freemium (Subscription)
    • Proprietary

    Application type

    Since

    • Since 2018

    Platforms

    • Online
    • US flagUnited States
    This is the App Dashboard, the first thing you’ll see when you log into Skylight. The dashboard gives you a high-level view of how your app is performing and acts as a starting point for digging into the details.
    The Endpoint View is the heart and soul of Skylight. More than just looking pretty, this page is the end result of distilling thousands of data points into actionable information that you can use to speed up your app.
    Our weekly Trends Email distills your performance data into a beautiful, actionable report that helps you catch slowdowns before your customers do.
    3 alternatives