CanvasXpress is a standalone HTML5 graphing library written in Javascript that includes a simple and unobtrusive user interfase to explore complex data sets.
Cost / License
- Free
- Proprietary
Application type
Platforms
- Online
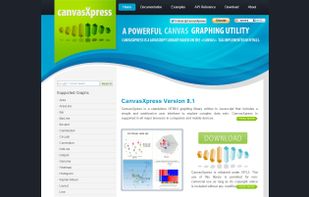


CanvasXpress is a standalone HTML5 graphing library written in Javascript that includes a simple and unobtrusive user interfase to explore complex data sets.

 United States


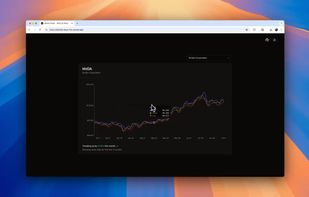
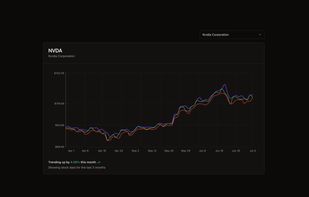
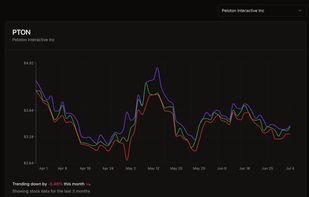
A real-time stock charting app built with Next.js, TailwindCSS, and Shadcn/UI. It uses React Server Components, Suspense, and Streaming for server-rendered stock price data from the Polygon.io API. Setup takes 2 minutes with a one-click deploy to Vercel option.


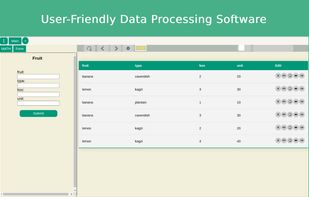
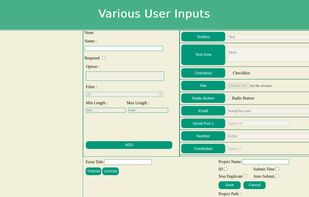
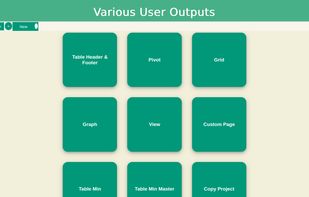
Data processing software with a simple GUI, and has many types of input (text, numbers, serial communication, etc.) and output (graphs, tables, serial communication, etc.). Suitable for analyzing and visualizing data.



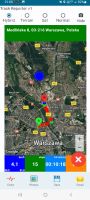
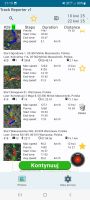
Track Reporter – Your smart GPS tracker with photos, route playback, and visual report.
 Poland
 EU
EU