EM Spectrum Visualizer
A multi-purpose graphical, educational, scientific, interactive, online, multimedia presentation / physics tool to explore, learn, calculate and visualise everything around the electromagnetic spectrum. Shows bands, discrete frequencies, graphs..
Cost / License
- Free Personal
- Open Source
Platforms
- Online
EM Spectrum Visualizer
Features
Properties
- Educational
Features
- Browser-based
- Interactive Visualization
Tags
- scientific
- Online Presentation
- scientific-calculator
- interactive
- visualization
- physics
- electromagnetic
- rich-internet-applications
- scientific-convertor
- educational-tool
- em-spectrum
- Online Tool
- spectrum-viewer
EM Spectrum Visualizer News & Activities
Recent activities
EM Spectrum Visualizer information
What is EM Spectrum Visualizer?
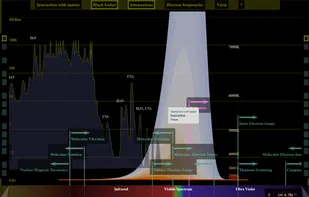
A multi-purpose graphical, educational, scientific, interactive, online, multimedia presentation / physics tool to explore, learn, calculate and visualise everything around the electromagnetic spectrum.
Shows frequencies & wavelengths with spectrum bands, different overlays and text explanations / wiki.
Features: ? Well-know EM spectrum (sub)bands with a short explanation of each (with uses, charecteristics, etc..) Radio waves • Microwave • Infrared • Visible spectrum • Ultraviolet • X-ray • Gamma ray • Cosmic waves ? Calculator, converting between frequency, wavelength and photon energy (eV) Jumps to the converted position ? A "mouse hover pointer" which gives you detailed frequencies ? Independant graphical overlays which you can switch on and off: ? Interaction with matter = Processes at (sub)atomic level with explanation Nuclear Magnetic Rotation • Molecular rotation and torsion / vibration • Atomic, molecular and inner electronic jumps • Inonisation • Scattering (Rayleigh, Raman, Thomson, Compton) • Nuclear Jumps • Pair Production ? Frequency applications (ECA, more to follow) ? Frequency allocations (ITU 1, ECA, more to follow) ? Atmospheric attenuation ? Black bodies ? Irradiance / spectrum of the sun ? Well-known frequencies ? Emission lines (H, O2, more to follow) ? Wavelength sizes comparison with some well known things such as a building, insect, cell, virus, amino acid, atoms, ..