D3.js is a JavaScript library for manipulating documents based on data. D3 helps you bring data to life using HTML, SVG, and CSS.
+6

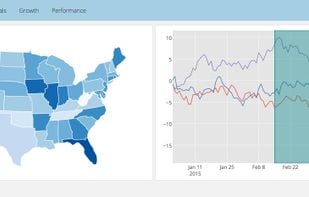
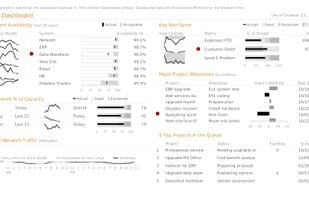
D3plus is described as 'Data visualization made easy. A javascript library that extends the popular D3.js to enable fast and beautiful visualizations' and is an website in the development category. There are eight alternatives to D3plus, not only websites but also apps for a variety of platforms, including Self-Hosted, Mac, Windows and Linux apps. The best D3plus alternative is D3.js, which is both free and Open Source. Other great sites and apps similar to D3plus are Plotly, Koia, Squey and CanvasJS Charts.
D3.js is a JavaScript library for manipulating documents based on data. D3 helps you bring data to life using HTML, SVG, and CSS.
Plotly is the easiest way to graph and share data online. Open-source libraries for JavaScript (comparison with HighCharts at https://plot.ly/highcharts-alternative/), Python, R, and MATLAB.

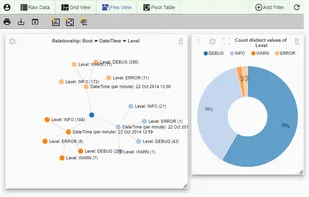
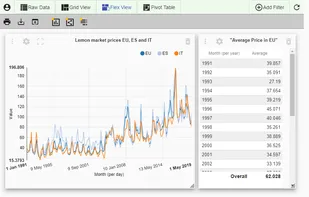
Create graphs online with CSV, Excel or JSON data. Choose from different chart types, pivot tables and relationship graphs. Easy, user-friendly, open- source.
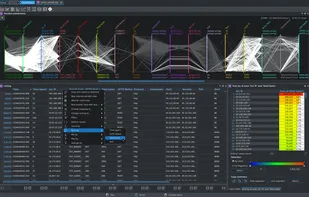
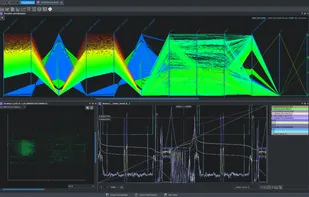
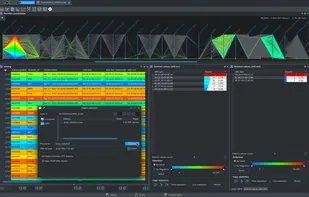
Squey is an open-source visualization software designed to interactively explore and understand large amounts of tabular data.
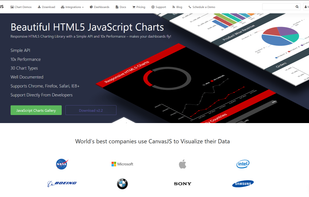
CanvasJS is an easy to use HTML5 and Javascript Charting library. It runs across devices including iPhone, iPad, Android, Windows Phone, Microsoft Surface, Desktops, etc. This allows you to create rich dashboards that work on all the devices without compromising on...
Flexible, cross-platform and cross-browser JavaScript (HTML5) charting library that allows you to create interactive bar, pie, line, spline, area, Gantt, stock and other charts, maps and dashboards, with real-time updates and multi-level drill-downs.
The world's most interactive data visualization software. Supercharged touch-screen enabled HTML5 Graph and Chart library, written in fast cross-platform JavaScript, runs in all browsers.

Build Remarkable Analytics Experiences. The toolkit for building fast, interactive, fully-custom analytics experiences into your app.